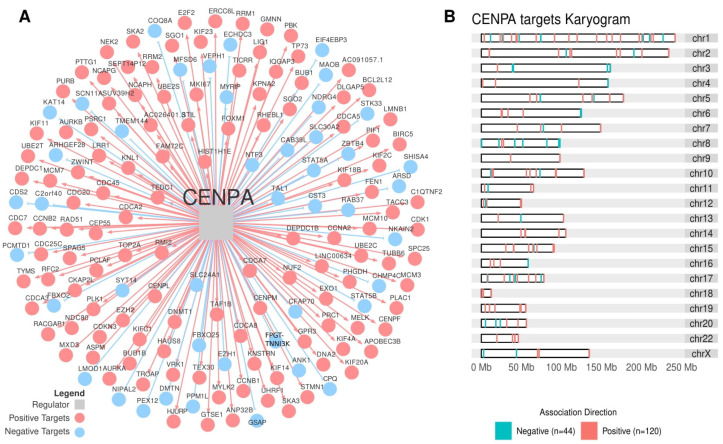
Figure 7.
The CENPA regulon. (A) The transcription factor CENPA (grey square at the center) and its targets are inferred by the regulatory network analysis. Blue circles indicate targets with a negative association, while red circles indicate targets with a positive association. (B) The karyogram presents the distribution of CENPA targets in the chromosomes.

