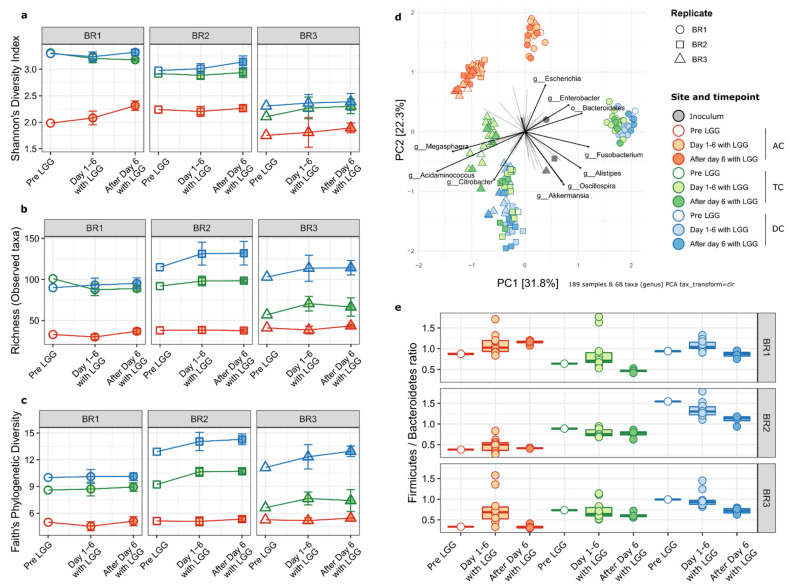
Figure 4.
Community diversity and F/B ratio. Alpha-diversity metrics display consistent patterns regardless of LGG addition. For all three bioreplicates, the TC and DC are significantly higher in all sites while within each site, diversity does not change over time relative to LGG addition. (a) Shannon’s diversity index, (b) richness (observed ASV counts) (c) Faith’s phylogenetic distance. Colon regions (reactors) are shown by colors. Red, AC; Green; TC; Blue, DC. (d) PCA biplot of total ASV abundances showing samples (points) and taxa (arrows). Points are colored by site and time relative to LGG addition, with shapes representing the bioreplicates. The top ten taxa driving the distribution of samples are shown as arrows with the length of arrows representing the PCA loadings (strength of association). TC and DC samples are more similar to each other than to AC samples. BR2 and BR3 samples are more similar to each other than to BR1 samples. (e) Boxplots showing Firmicutes to Bacteroidetes ratio for samples. Boxes show first to third quartiles and median. Individual sample ratios are shown as points.

