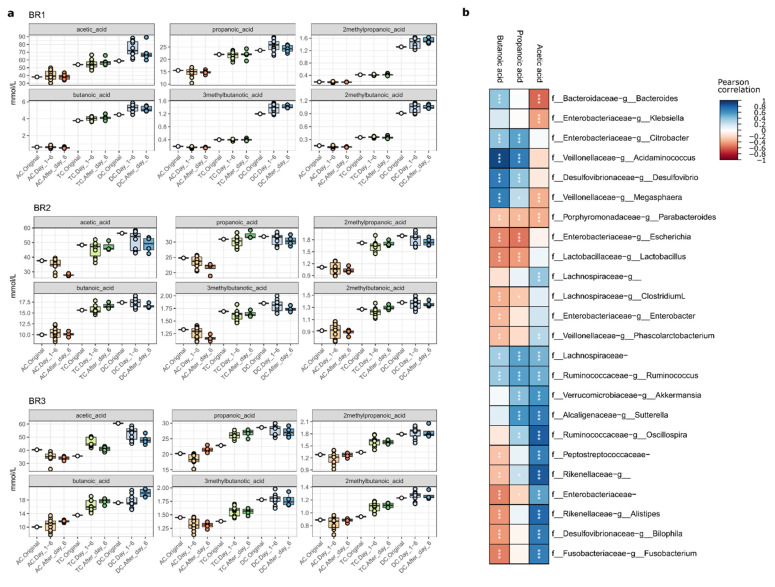
Figure 6.
Short-chain fatty acid analysis. Concentrations of key SCFAs correlate with specific taxa. (a) SCFA concentrations generally increase along the reactor system, but do not always increase following LGG addition in individual reactors. Boxplots show IQR and median, with individual samples shown as points. (b) Pearson correlation between taxon relative abundance (ASVs summed at genus level) and three key SCFAs. Significant correlations are shown with asterisks. * p < 0.05; ** p < 0.01; *** p < 0.001.

