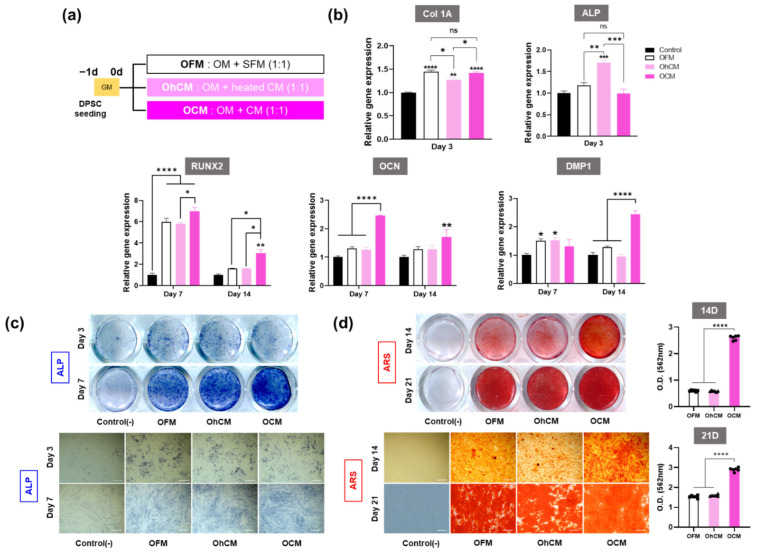
Figure 3.
hGF-CM potentiates SHED odonto/osteogenic differentiation (a) Schematic diagram showing the schedule and groups of experiments. (b) Relative odonto/osteogenic gene expression levels quantified by qRT-PCR, with early markers at Day 3 and late markers at Days 7 and 14. (c) Representative images of alkaline phosphatase (ALP) activity analyzed by ALP staining at Days 3 and 7 and (d) mineralization analyzed by Alizarin Red staining at Days 14 and 21 after culturing in OFM, OhCM, or OCM. The graphs show the quantification of mineralization at Days 14 and 21. (c) All data are represented as the mean ± SD. All data are represented as the mean ± SD. One-way analysis of variance followed (ANOVA) by Tukey’s multiple comparisons test was used to detect statistically significant differences between groups. Represents * p < 0.05, ** p < 0.01, *** p < 0.001, **** p < 0.0001, ns = not significant, scale bar = 200 µm. OFM: hGF-CM diluted by 50% with odontogenic medium, OhCM: heated CM (CM heated at 95 °C for 30 min to denature the proteins) diluted by 50% with odontogenic medium, OCM: SFM diluted by 50% with odontogenic medium.

