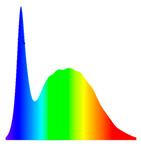
Table 7.
LED light treatments and their spectral and energy characteristics.
| LED Treatment | Wavelength Spectra (nm) | Electric Intensity (mA) | Luminous Flux per Unit Area (lx) | PPFD |
|---|---|---|---|---|
| White light (control) |
 (380–780 nm) |
20 mA | 225 | 7 |
| Red light |
 (580–660 nm) |
80 mA | 35 | 7 |
| Blue light |
 (430–520 nm) |
60 mA | 210 | 7 |
