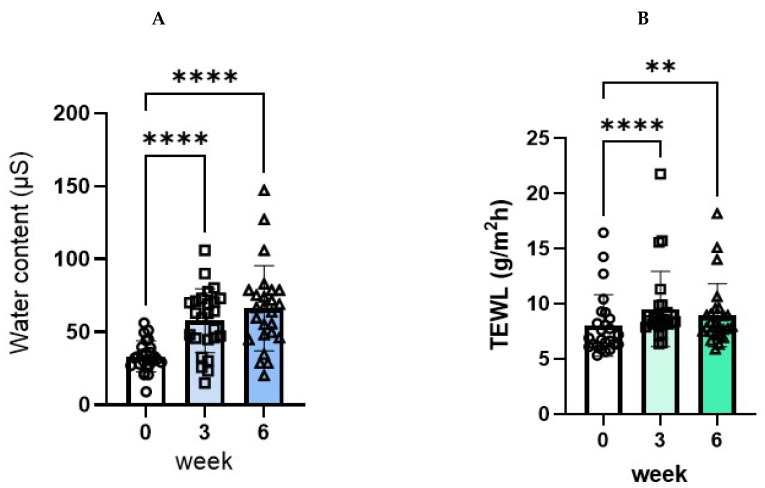
Figure 9.
Effects of the POLG nano-emulsion on water content and TEWL. (A): Water content: n = 25, all data were analyzed using Tukey’s multiple comparison test and are expressed as means ± SD. (B): Barrier function: n = 25, all data were analyzed using Dunn’s multiple comparison test and are expressed as means ± SD. **: p < 0.01, ****: p < 0.0001 compared to week 0.

