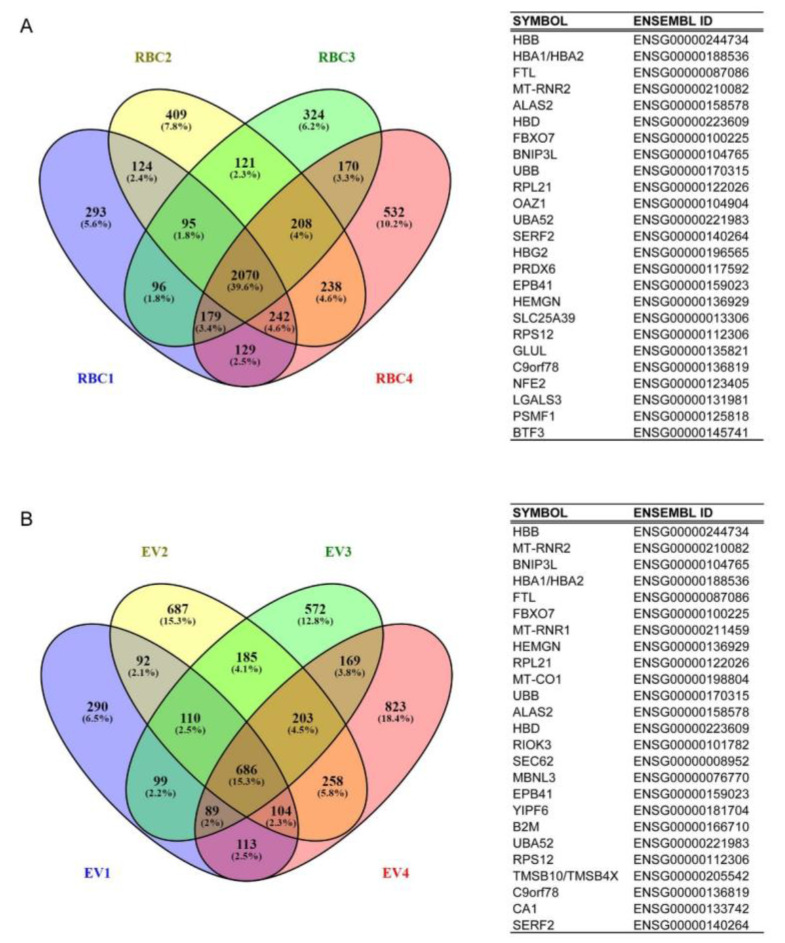
Figure 2.
RBC (A) and EV (B) transcriptomes. Venny’s diagrams show the number of expressed genes for individual samples as well as those shared in all samples. The gene lists (minimum 5 counts/gene) from RBC and EV samples were compared with the Venny 2.1.0 tool using Ensembl gene IDs. On the right, the 25 most highly expressed genes are shown in the corresponding transcriptomes. The full lists with gene names and expression values are shown in Supplementary Tables S2 and S3. Data was annotated using QIAGEN’s Ingenuity® Pathway Analysis (IPA®, QIAGEN, 16 December 2016) or Ensembl genome browser (http://www.ensembl.org, release 88-Mar 2017, accessed on 3 April 2017).

