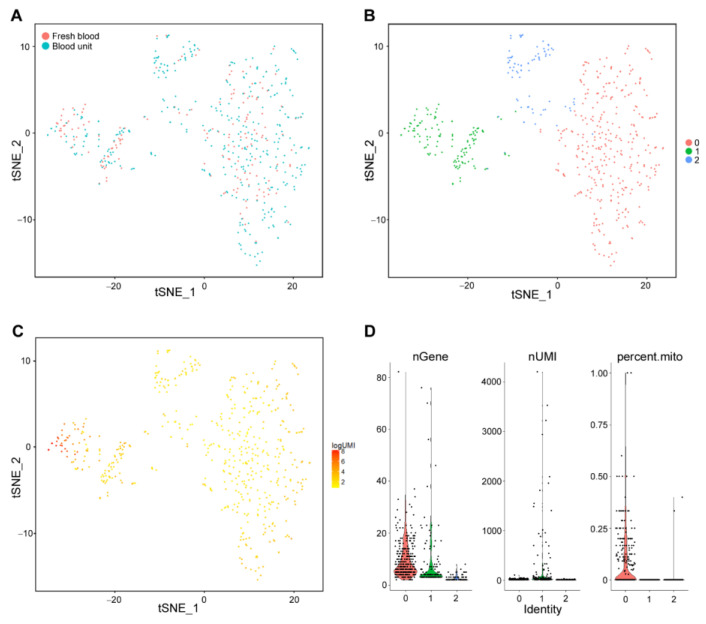
Figure 4.
Single-cell analysis of RBCs reveals three distinct cell populations. (A) 2D t-distributed stochastic neighbor embedding (t-SNE) projection of 554 RBCs, with each cell colored based on their sample ID (blue; cells from blood unit, red; cells from the fresh sample. (B) The tSNE projection of 554 RBCs, where each cell is grouped into one of the identified 3 clusters (0, 1, 2). (C) tSNE projection of 554 RBCs, with each cell colored based on their total unique molecular identifier (UMI), counts on a logarithmic scale. (D) Violin plots showing the distribution of the total number of genes (nGene), total UMIs (nUMI), and the percentage of mitochondrial gene expression (percent.mito) per cell for the identified three RBC clusters.

