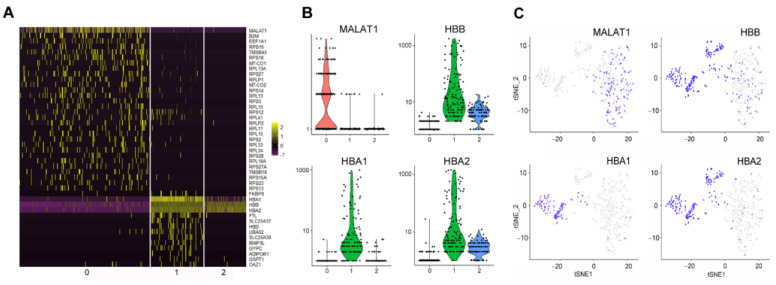
Figure 5.
Three RBC populations are characterized by specific marker gene expression profiles. (A) A heatmap showing the top 30 marker genes for each RBC cluster. The expression of each gene is normalized against the total expression within the cell. (B) Violin plots showing the expression of MALAT1, HBB, HBA1 and HBA2 genes as the unique molecular identifier (UMI) counts per cell. (C) T-distributed stochastic neighbor embedding (tSNE) projection of 554 RBCs, with each cell colored based on its expression of MALAT1, HBB, HBA1, and HBA2 genes. Blue color indicates a positive expression, and gray indicates a negative expression.

