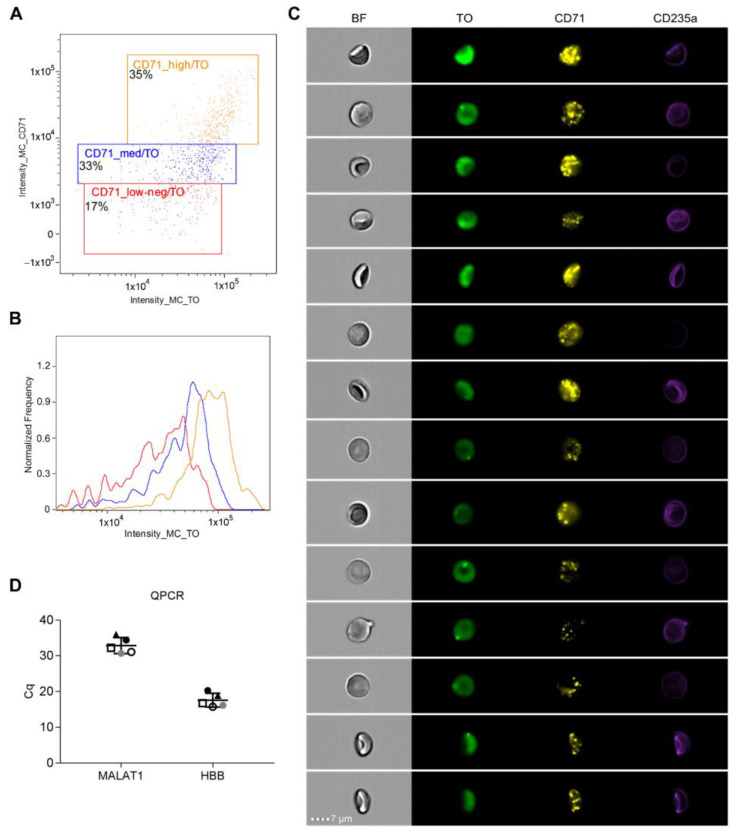
Figure 7.
Characterization of enriched reticulocytes using imaging flow cytometry and Q-PCR. Imaging flow cytometry was performed for CD71-enriched cells, stained with CD71-PE and CD235a-PB antibodies and thiazole orange (TO) for RNA content. (A) A dot plot image showing double positive cells for CD71 and TO, as well as gates for CD71_high, CD71_medium, and CD71_low-neg populations from a representative sample. (B) An overlay of flow cytometry histograms demonstrates the intensity range of TO RNA stain in different CD71 populations. (C) Representative image gallery showing different morphologies and staining patterns for CD71-enriched cells. Each cell is represented by a row of four images acquired simultaneously in flow, from left to right: brightfield (BF), the RNA binding dye TO (green), CD71-PE (yellow), CD235a-Pacific Blue (violet). Scale bar 7 µm. (D) The expression of the MALAT1 and HBB genes in the CD71-enriched samples (n = 5) is shown as quantification cycle (Cq) values. Lines depict the mean ± SD of all replicates. Corresponding samples are illustrated with matching symbols.

