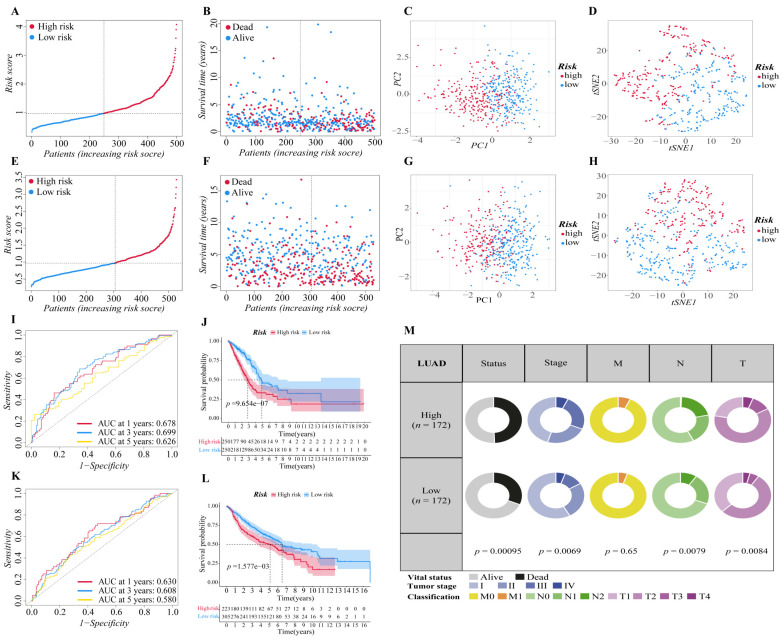
Figure 2.
Validation of the six-gene signature in two cohorts. (A,E) The distribution and median value of the risk scores in two cohorts ((A): training cohort; (E): validation cohort). (B,F) The distributions of survival status, overall survival time and risk score ((B): training cohort; (F): validation cohort). (C,G) Principal component analysis (PCA) of two cohorts ((C): training cohort; (G): validation cohort). (D,H) t-SNE analysis of two cohorts ((D): training cohort; (H): validation cohort). (I,K) ROC curve analysis shows the prognostic prediction efficiency of the signature ((I): training cohort; (K): validation cohort). (J,L) Kaplan–Meier curves for the OS of patients in the high- and low-risk groups of two cohorts ((J): training cohort; (L): validation cohort). (M) Pie charts showing the Chi-squared test of clinicopathologic factors in LUAD tumor samples from the TCGA.

