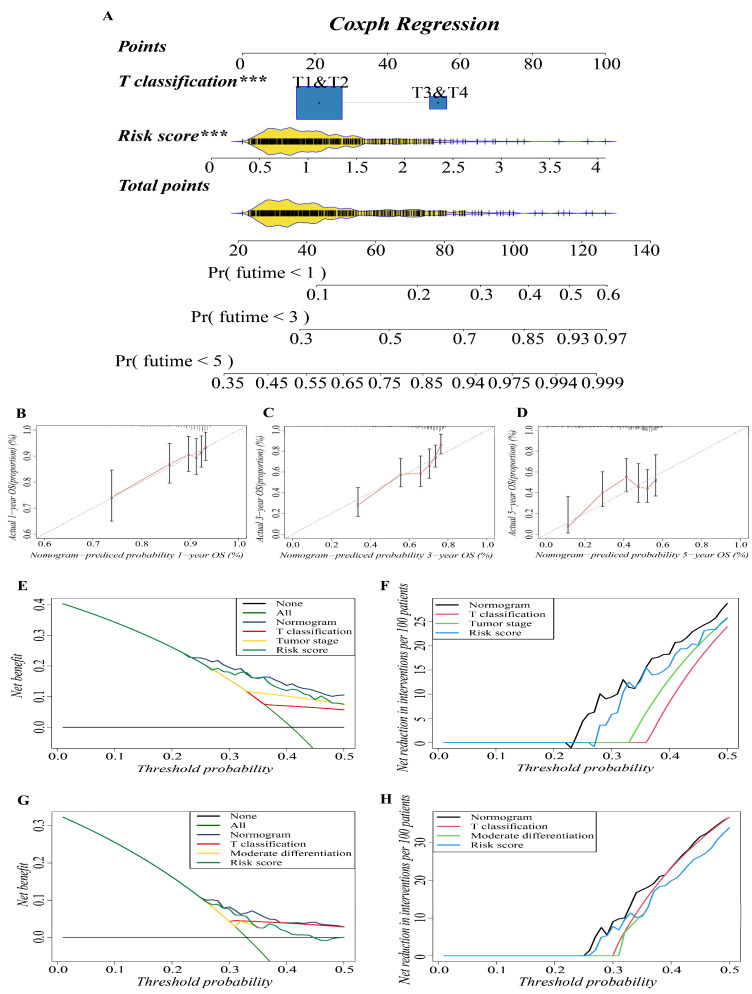
Figure 4.
Construction and validation of the predictive nomogram. (A) The nomogram for OS prediction at 1, 3 and 5 years was constructed in the training cohort. A value of p < 0.05 indicates a statistically significant difference, *** indicates p < 0.001. (B–D) Calibration plots of the nomogram for OS prediction at 1, 3 and 5 years in the training cohort, respectively. (E,G) Net decision curve analyses demonstrating the benefit of predicting LUAD patients’ prognosis ((E): training cohort; (G): validation cohort). (F,H) The net reduction analyses based on nomogram model and other models ((F): training cohort; (H): validation cohort).

