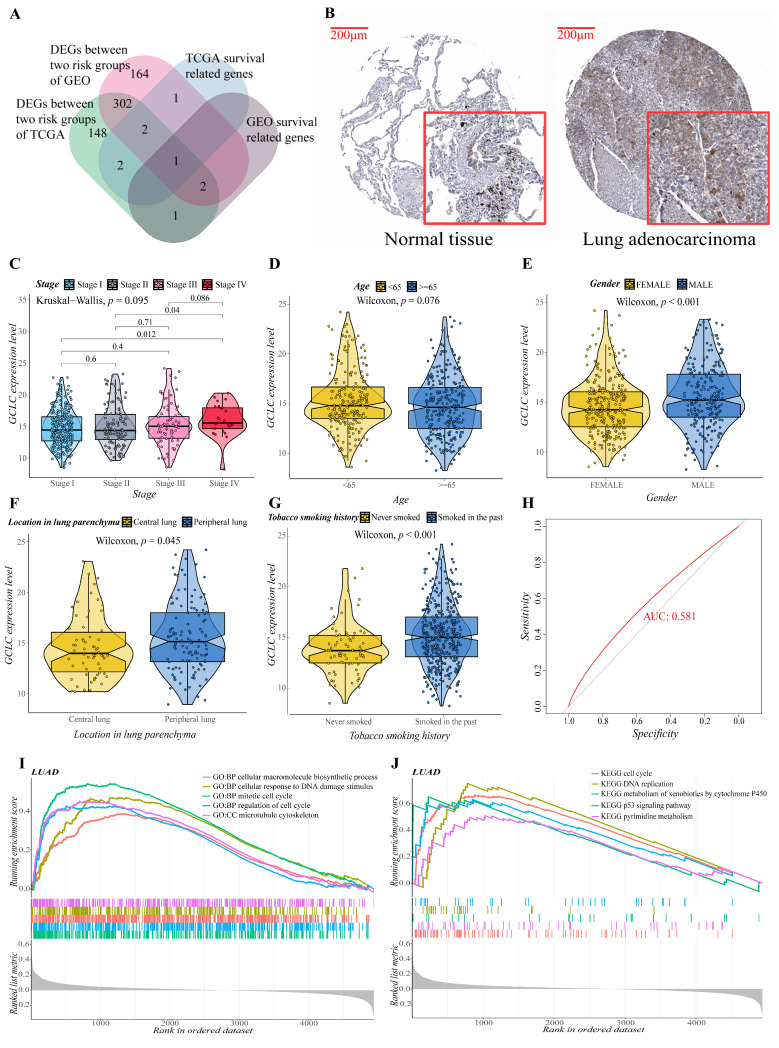
Figure 7.
Evaluation of the prognostic value and predictive potential of GCLC. (A) Venn diagram of four groups of genes (green: DEGs between two risk groups of training cohort; red: DEGs between two risk groups of validation cohort; blue: survival-related genes of training cohort; brown: survival-related genes of validation cohort). (B) GCLC protein expression in LUAD tissue samples and corresponding non-cancer tissue samples. GCLC protein levels were upregulated in LUAD tissues compared to the corresponding non-cancer tissues in the IHC results from the HPA database. (C–G) Correlation between GCLC expression level and various clinical characteristics ((C), tumor stage; (D), age; (E), gender; (F), the location of the tumor in the lung parenchyma; (G), tobacco smoking history). The test for association between paired samples used Pearson’s correlation coefficient. Two-tailed statistical p values were calculated by a two-sample Mann–Whitney test or Student’s t-test when appropriate. (H) ROC curve analysis shows the prognostic prediction efficiency of GCLC. (I,J) GSEA analysis showed the top five GO (I) and KEGG (J) enrichment results of the high- and low-expression groups of GCLC.

