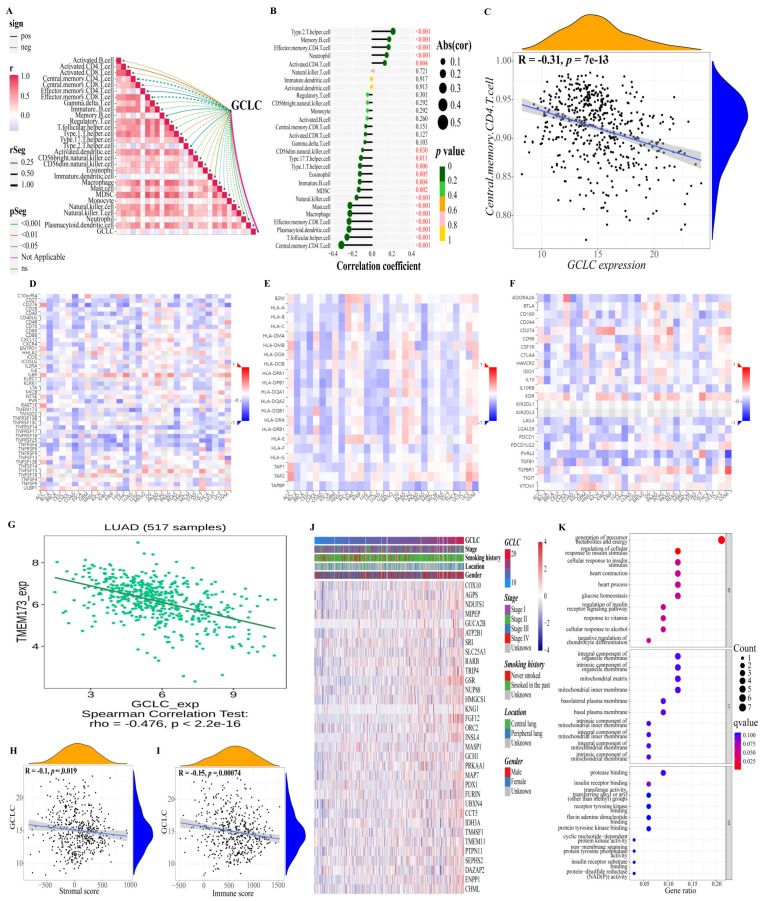
Figure 8.
Further study of GCLC in immunity and gene correlation. (A,B) Correlations between GCLC and 28 kinds of immune cells ((A): heat map; (B): lollipop graph). (C) There is a decent correlation coefficient between central memory CD4 T cell and the expression level of GCLC. (D–F) The heat map shows the relations between three kinds of immunomodulators ((D), Immunostimulator; (E), MHC molecule; (F), Immunoinhibitor) and the expression of GCLC in Pan-cancer. (G) TMEM173 has a strong correlation with the expression of GCLC in patients with LUAD. (H,I) The correlation between the level of GCLC expression and the tumor stromal cell scores (H) and immune cell scores (I). (J) The heat map shows the relation between the expression of the 33 genes and some LUAD patient clinical characteristics. (K) The dot map shows the GO enrichment analysis results of 33 genes.

