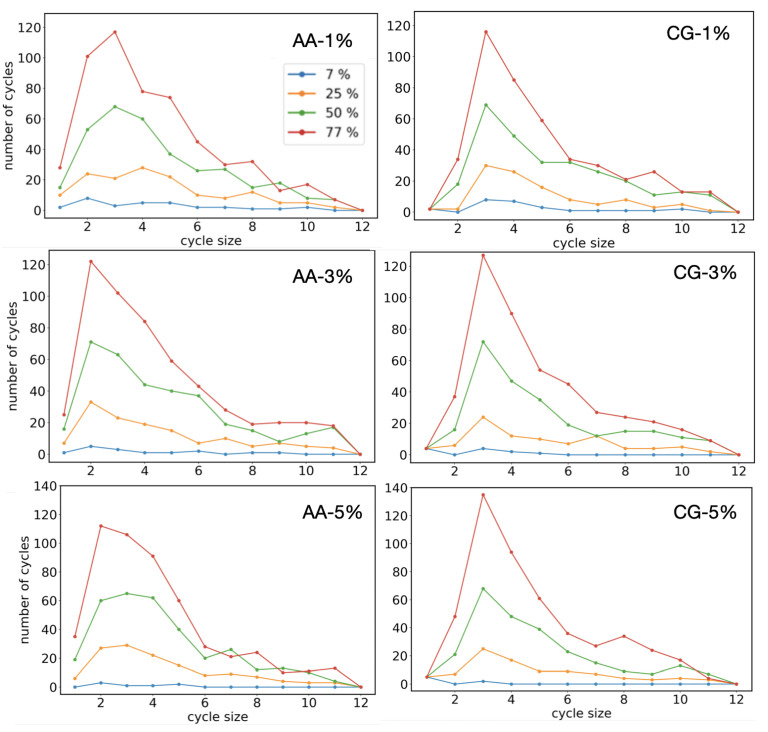
Figure 9.
Cycles size distribution for the AA (from Ref. [10]) and CG systems at different stages of the polymerization process in double bonds conversion values and different initial radical concentrations. The distribution was computed as the mean over a set of 20 independent trajectories. The standard deviation (not reported in figure) was found to be always less than 5% of the corresponding mean values.

