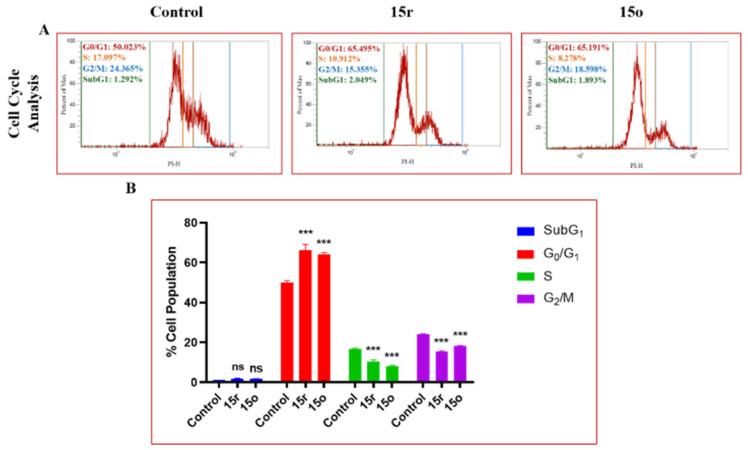
Figure 4.
(A) Treatment with 15o (2 µM) and 15r (1 µM) in HT-29 cells showed significant G0/G1 phase arrest as indicated by the increase in G0/G1 phase cell population. (B) Bar graphs depict SubG1, G0/G1, S, and G2/M cell populations. Statistical significance was determined by two-way ANOVA followed by Tukey’s post-hoc analysis, where *** p < 0.001 represents control vs. 1,2,4-triazolo-linked bis-indolyl (15o and 15r) conjugates in treatment groups and ‘ns’ represents not statistically significant in comparison to control.

