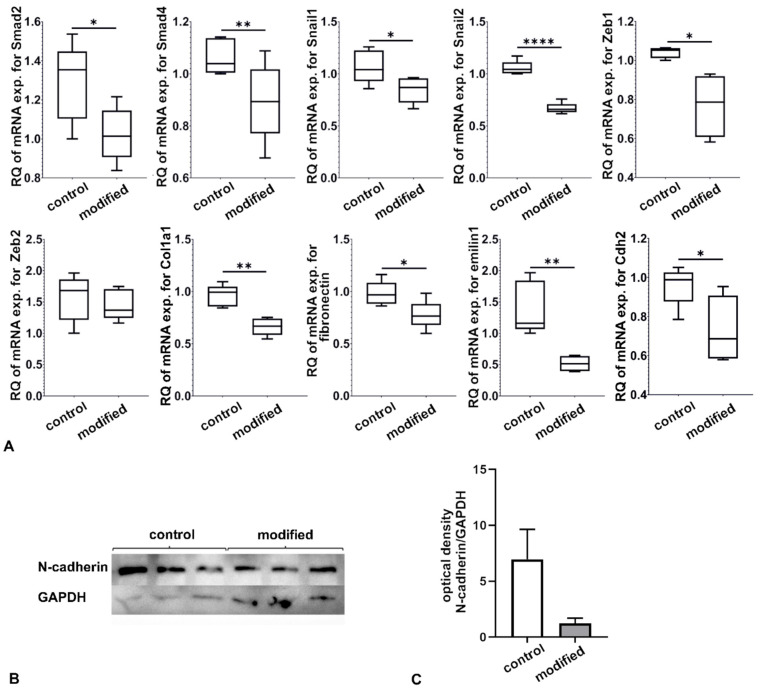
Figure 3.
(A) Expression of mRNA of selected genes in LECs after incubation with modified RAW 264.7 macrophage supernatant. Gene expression was measured via relative quantification (RQ) with a comparative CT method. The results shown are obtained from five independent experiments (n = 5) with technical duplicates. For the statistical analysis of the results (n = 6), the Student’s t-test (* p ≤ 0.05; ** p < 0.01; **** p < 0.0001) was used. (B) Assessment of the amount of N-cadherin protein in cultured LECs detected with Western blotting. (C) The WB results obtained from three independent experiments (n = 3) are shown as the ratio of the optical density of N-cadherin to the optical density of GAPDH. The Student’s t-test was used for the statistical analysis of the results.

