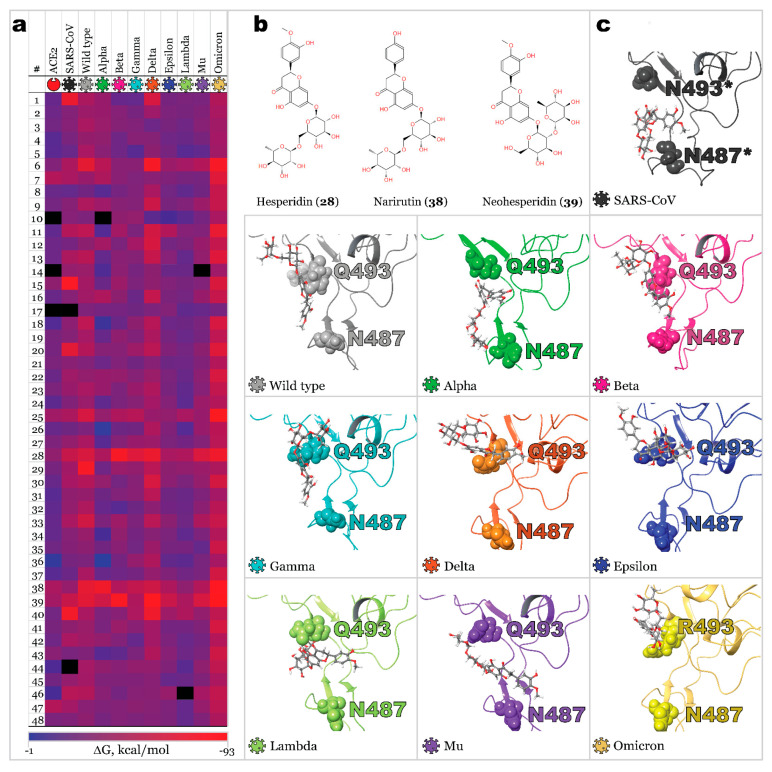
Figure 6.
Results of MM-GBSA calculation: (a)—Free binding energies of ligand-protein complexes presented as heat maps; (b)—Active compounds with the highest averaged affinity towards most SARS-CoV-2 RBD variants; (c)—3D structures of RBDs complexed with compound 28 (residues of interest are illustrated with CPK representation). * original sequence numeration for SARS-CoV was changed in this figure according to the alignment of residues for easier comparison.

