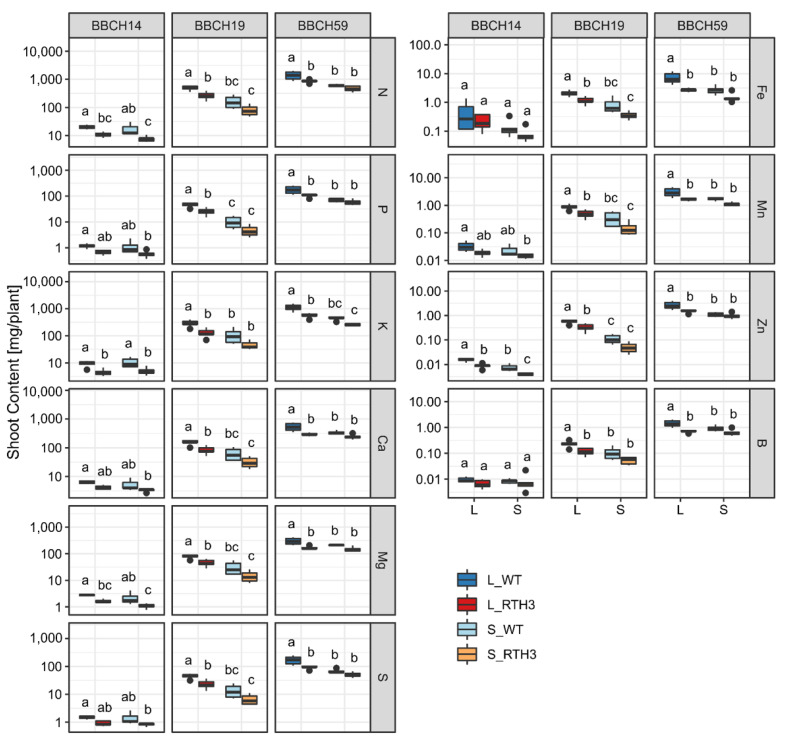
Figure 5.
Total mineral element contents (mg per plant) of the shoots. The amounts of the mineral nutrients are given by mg/plant. Note the different scales for the different mineral nutrients. Differences between treatments (p < 0.05) within one stage according to ANOVA and Tukey’s HSD test are indicated by different letters. L, loam: S, sand; WT, wild type; RTH3, root hair mutant.

