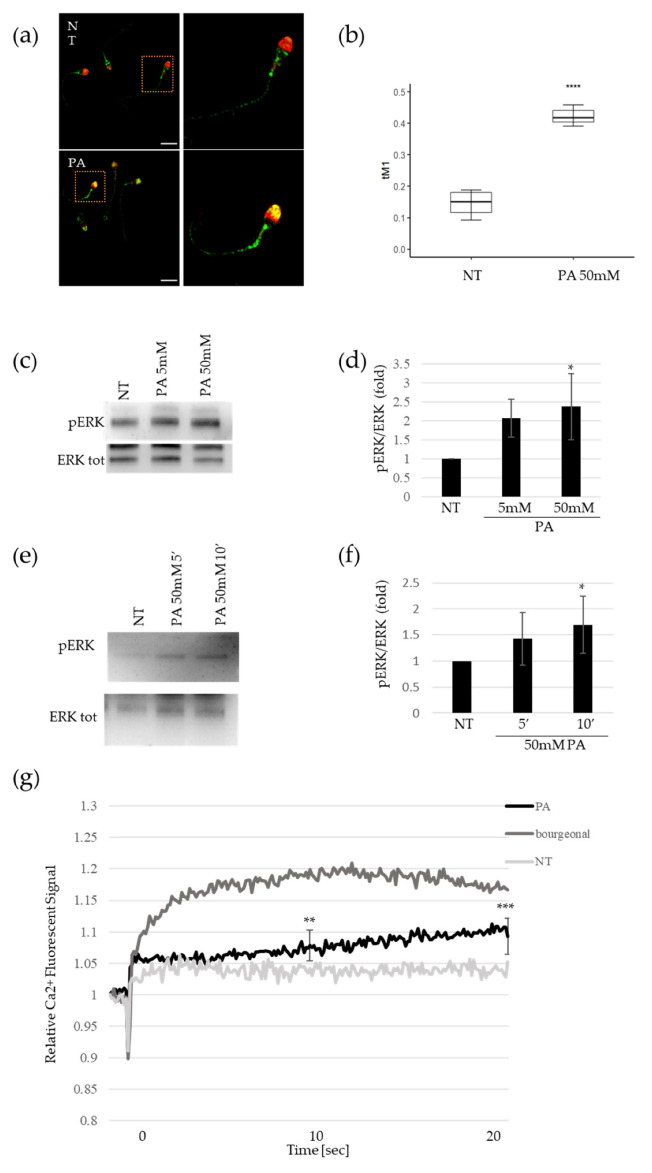
Figure 1.
Activation of spermatozoa by propionate. (a) Representative pictures of merged confocal immunofluorescence analysis of OR51E2 (green), and acrosomal compartment (counterstained with PNA, shown here in red) in sperm cells before (upper panels, NT) and after 50 mM PA treatment (lower panels, PA). Scale bar: 10 μm. (b) Histogram reports the value of tM1 co-localization coefficient of OR51E2-PNA, before and after PA treatment. Ten fields for each slide were counted (n = 30. **** = p < 0.0001, two-tailed unpaired t-test). (c) Representative Western blot (WB) analysis of pERK and total ERK protein in sperm cells treated with 5 and 50 mM PA. (d) Histogram shows the ratio of densitometric values of pERK to total ERK in PA dose-dependent experiments. The densitometric value of untreated sperm cells (NT) is arbitrarily set to 1. Mean ± SD of three independent biological replicates are shown (n = 6. * = p < 0.05, one sample t-test). (e) Representative Western blot (WB) analysis of pERK and total ERK protein in sperm cells treated for 5 and 10 min with 50 mM PA. (f) Histogram shows the ratio of densitometric values of pERK to total ERK in time–course experiments of PA treatment. The densitometric value of untreated sperm cells (NT) is arbitrarily set to 1. Mean ± SD of three independent biological replicates are shown (n = 3. * = p < 0.05, one sample t-test). (g) Time–course curve of Ca2+ influx in seminal fluids treated with 50 mM PA or 500 µM bourgeonal. The fluorescent signal at the time of acute compound injection is set to 1. The fluorescent signals recorded at 10 (middle time point) and 20 s (final time point) are obtained for statistical analysis in comparison to untreated samples (NT). Mean ± SD of six independent experiments are shown (n = 6. ** = p < 0.01, *** = p < 0.001, one sample t-test).

