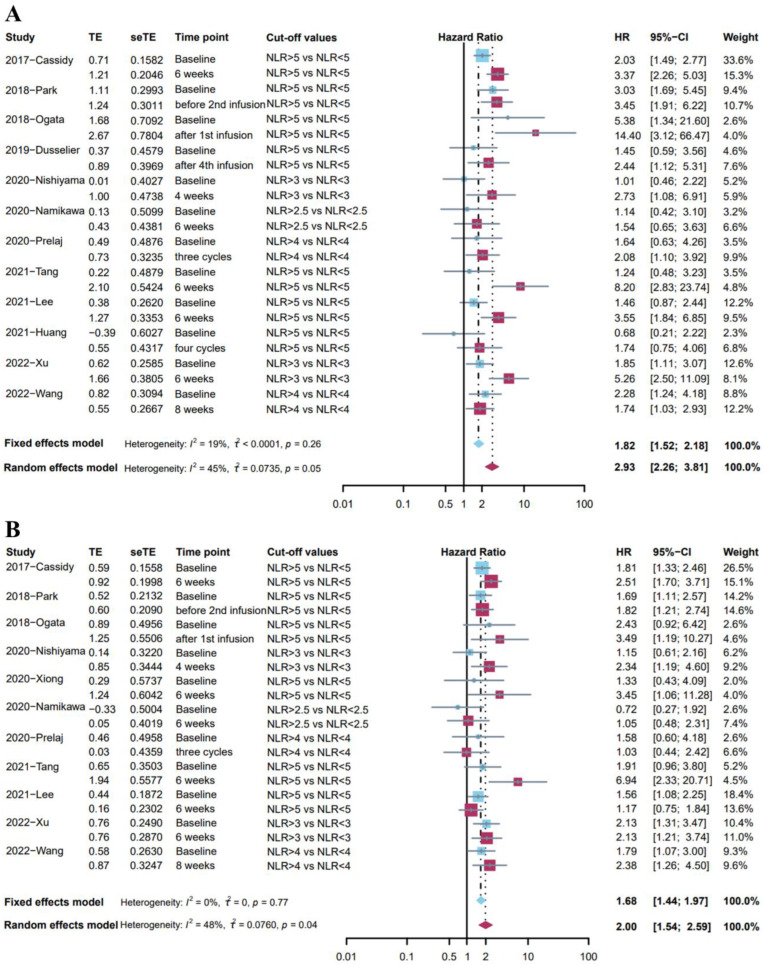
Figure 3.
(A) Forest plot for the association between high level of baseline NLR and OS (blue); the association between high level of post-treatment NLR and OS (red). (B) Forest plot for the association between high level of baseline NLR and PFS (blue); the association between high level of post-treatment NLR and PFS (red).

