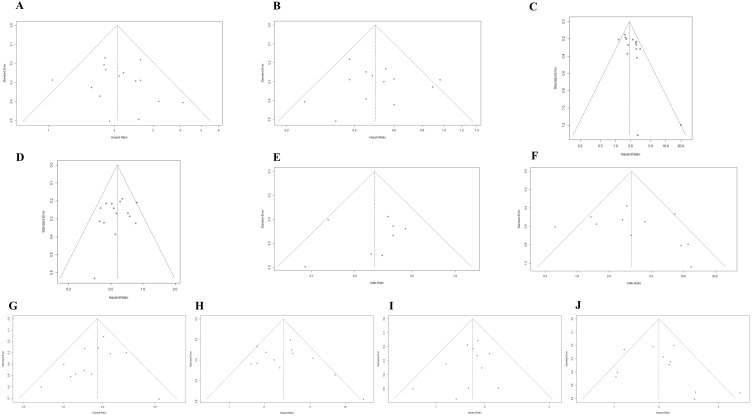
Figure 4.
(A) Funnel plot for the association between upward trend in NLR after ICI treatment and OS. (B) Funnel plot for the association between downward trend in NLR after ICI treatment and OS. (C) Funnel plot for the association between upward trend in NLR after ICI treatment and PFS. (D) Funnel plot for the association between downward trend in NLR after ICI treatment and PFS. (E) Funnel plot for the association between upward trend in NLR after ICI treatment and ORR. (F) Funnel plot for the association between downward trend in NLR after ICI treatment and ORR. (G) Funnel plot for the association between high level of baseline NLR and OS. (H) Funnel plot for the association between high level of post-treatment NLR and OS. (I) Funnel plot for the association between high level of baseline NLR and PFS. (J) Funnel plot for the association between high level of post-treatment NLR and PFS.

