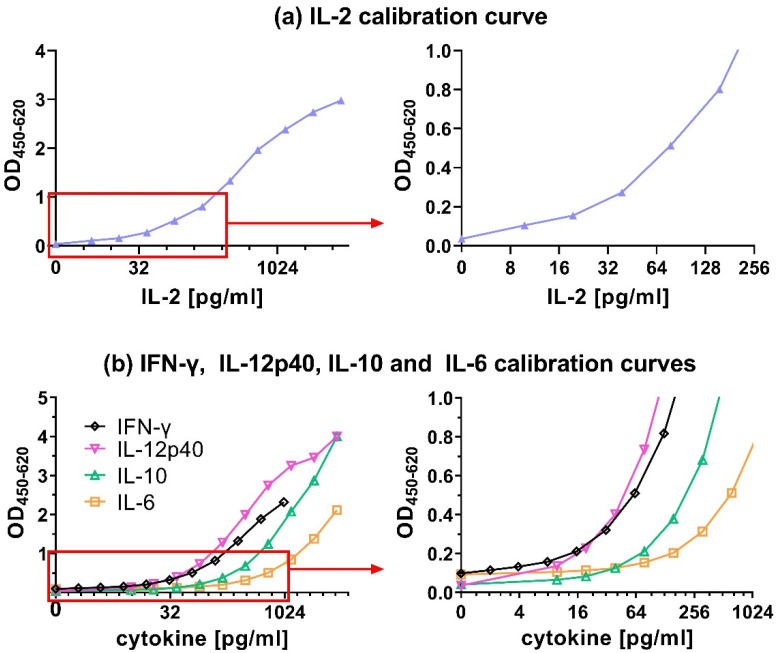
Figure 4.
Calibration curves for recombinant chicken (a) IL-2, (b) IL-6, IL-10 and IL-12p40 ranging from 9.8 to 5000 pg/mL, and IFN-γ ranging from 2 pg/mL to 1000 pg/mL presented at the full concentration range (left graphs) and the lower concentration range up to 1.0 OD (right graphs). All results represent absorbance signals.

