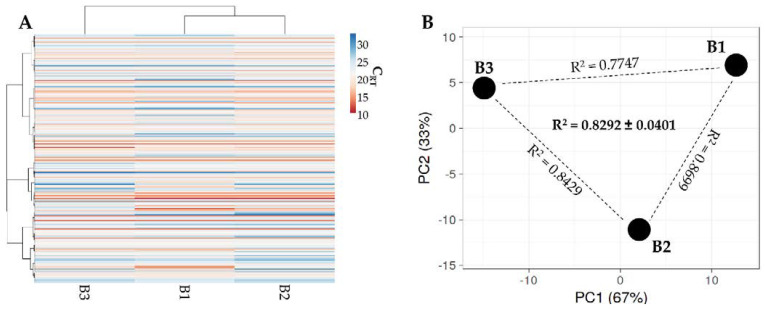
Figure 6.
Comparison of EV-miRNA expression profiles between BMSCs under study. (A) heat map of hierarchical clustering analysis of the normalized CRT values of detected miRNAs with sample clustering tree at the top. Absolute expression levels are indicated by the color scale: blue shades = low expression levels (high CRT values) and red shades = high expression levels (low CRT values). (B) Principal component analysis of the normalized CRT values of detected miRNAs. X and Y axes show principal component 1 and principal component 2 that explain 67% and 33% of the total variance.

