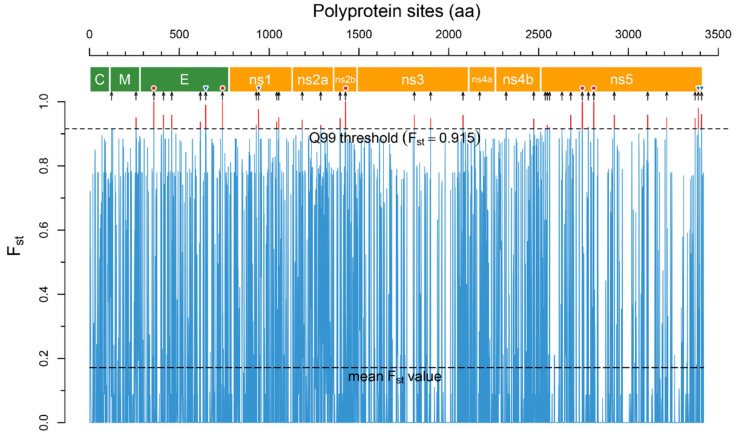
Figure 2.
The Fst plot across polyprotein sites reconstructed by the R script. Fst values were calculated for two groups of aa sequences–encephalitic viruses (TBEV, LIV, POWV) and hemorrhagic viruses (OHFV, KFDV). The narrow blue trace is mean Fst values for each polyprotein site, the upper dashed line is the Q99 threshold. The sites of the polyprotein with Fst above the Q99 threshold (highlighted by a red color) are potential disease form determinants. The polyprotein scheme was reconstructed based on the annotation of the TBEV strain SofjinKSY (AEP25267.2): the polygons colored in green are structural proteins, those coloured orange are non-structural proteins. The black arrows under the scheme indicate 36 determinant positions in the polyprotein. Red circles above the arrows show absolutely specific positions (Fst = 1.0) and blue inverted triangles show highly specific positions (Fst > 0.96).

