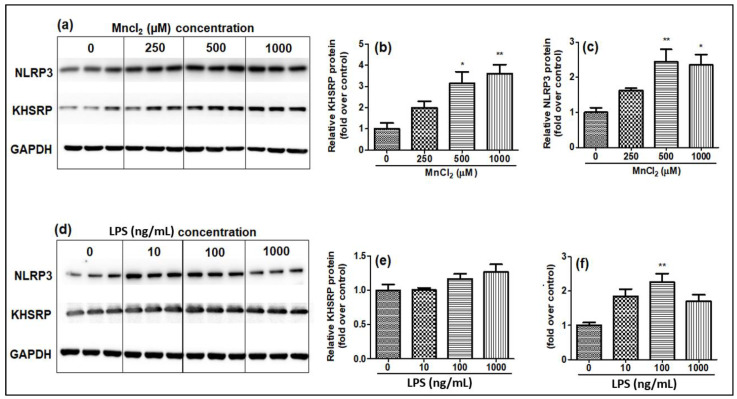
Figure 3.
Effect of MnCl2 and LPS on protein levels of KHSRP and NLRP3 quantitated by Western blot analysis 24 h post-exposure, relative band intensity quantified (a) Western blot analysis for the impact of MnCl2 exposure on NLRP3, KHSRP, GAPDH, (b) fold change in KHSRP protein levels (relative quantification) post-MnCl2 exposure, (c) fold change in NLRP3 protein post-MnCl2 exposure, (d) Western blot analysis for the impact of LPS exposure on NLRP3, KHSRP, GAPDH, (e) fold change in KHSRP protein levels (relative quantification) post-LPS exposure, (f) fold change in NLRP3 protein post-LPS exposure. Protein intensity values were normalized to the housekeeping protein, GAPDH, and expressed as a fold-induction over the control sample (set at a value of 1). Data represented as mean ± SEM. * p < 0.05, ** p < 0.001.

