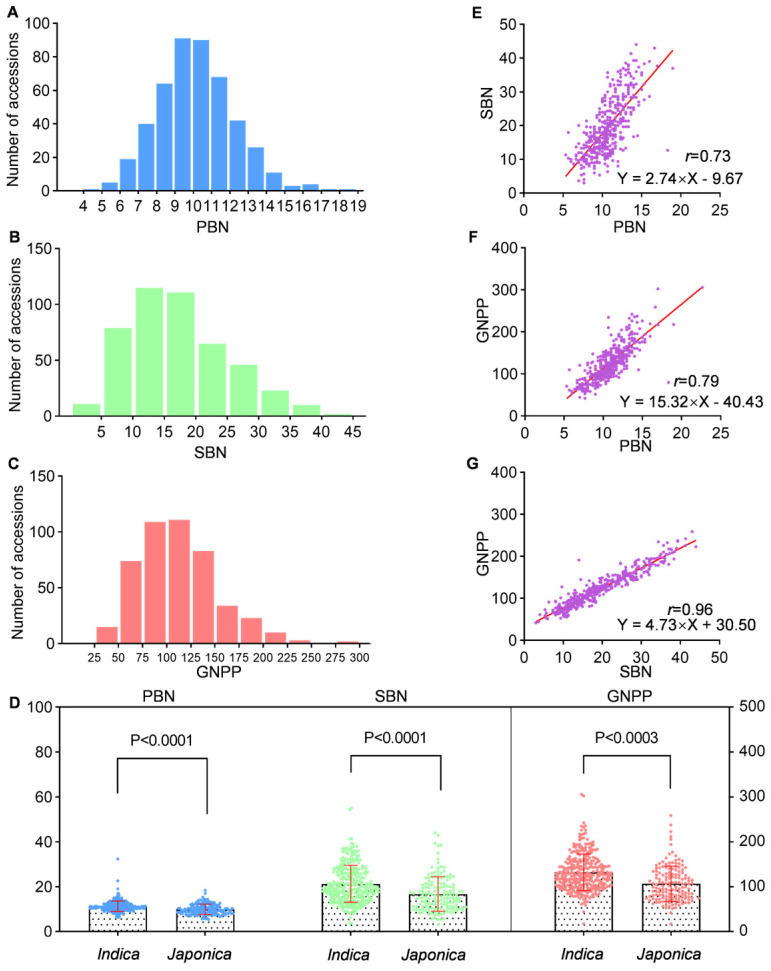
Figure 1.
The variation of PBN, SBN, and GNPP in 468 rice accessions. (A) Frequency distribution of PBN. (B) Frequency distribution of SBN. (C) Frequency distribution of GNPP. (D) Comparison of PBN, SBN, and GNPP between indica and japonica subpanels. (E) One-way regression analysis between PBN and SBN among all accessions. (F) One-way regression analysis between PBN and GNPP among all accessions. (G) One-way regression analysis between GNPP and SBN among all accessions. The r values represent the Pearson correlation coefficient. The p-values were obtained from the t-test.

