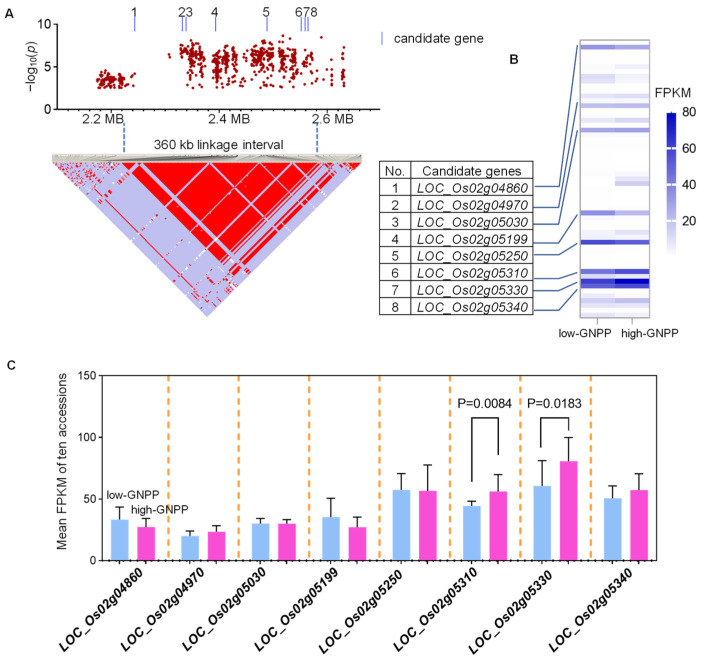
Figure 5.
Expression levels of 57 genes in qPSG1. (A) Linkage disequilibrium plot for SNPs with −log10(p) value > 2.5 in qPSG1 on Chr. 2. (B) The expression levels of all 57 genes in the 360 kb linkage interval of qPSG1 in young panicles of ten high-GNPP and ten low-GNPP accessions from 468 rice accessions. (C) The expression levels of eight candidate genes in young panicles of ten high-GNPP and ten low-GNPP accessions from 468 rice accessions. Eight candidate genes with high expression are numbered from 1 to 8. The blue lines indicate the position of eight candidate genes with high expression levels. The light blue and pink bars indicate the gene expression in ten high-GNPP and ten low-GNPP accessions, respectively. Expression data represent mean FPKM values (n = 10). The p-value is obtained from the t-test.

