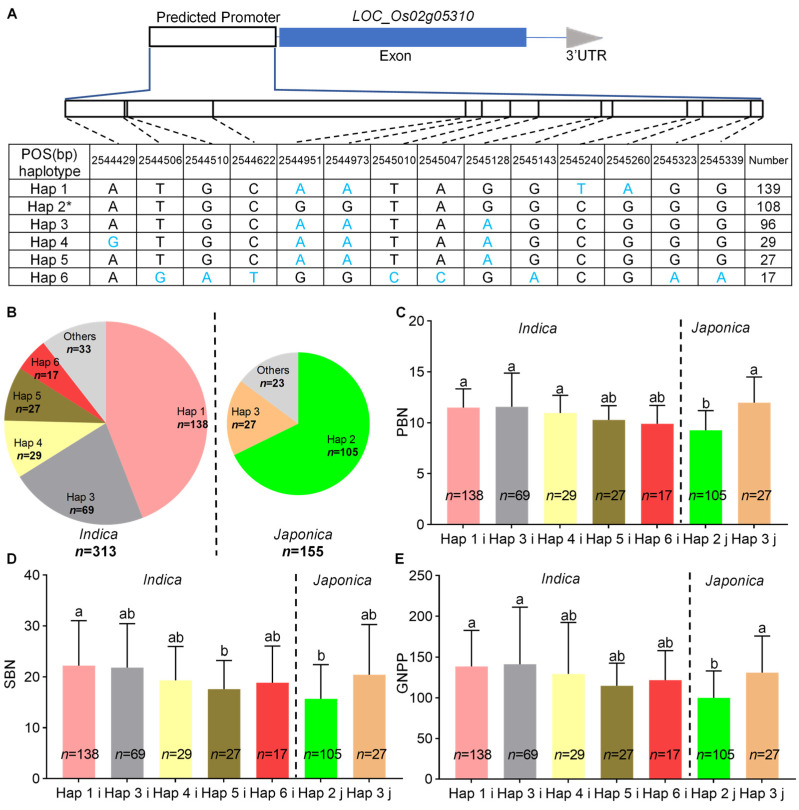
Figure 6.
Haplotype analyses of LOC_Os02g05310. (A) Schematic representation of LOC_Os02g05310 structure and the positions of 14 SNPs used for haplotype analysis. SNPs that differ from the reference sequence are marked with blue letters. (B) The haplotype frequency distribution of LOC_Os02g05310 in the two subpanels, indica and japonica. Comparisons of (C) PBN, (D) SBN, and (E) GNPP among accessions with different haplotypes in the two subpanels, indica and japonica. * indicates the haplotype is the same as NPB. Others in the pie chart indicate haplotypes with a frequency of less than ten. The i and j behind Hap in (C–E) indicate indica and japonica accessions with relevant haplotypes, respectively. Different lowercase letters indicate significant differences among accessions with different haplotypes based on Duncan’s new multiple-range test (p < 0.05).

