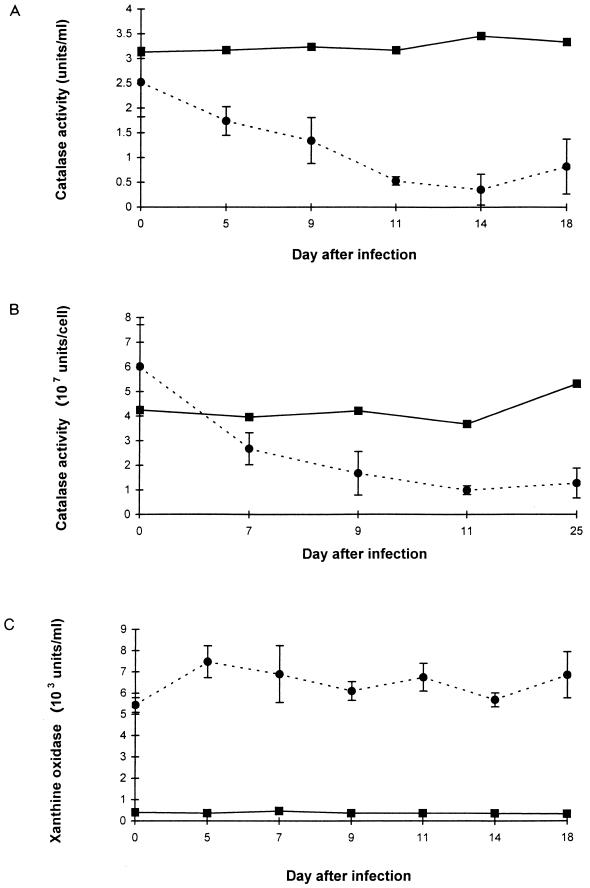
FIG. 3.
Impact of trypanosome infection on Cape buffalo and cattle. (A) Serum catalase levels; (B) RBC catalase levels; (C) serum xanthine oxidase levels. Results are means and SD of samples collected from three Cape buffaloes (●) and means of sera collected from two cattle (■) before and on various days after infection with T. brucei A4 and T. congolense 1180. Values obtained with the two cattle did not differ by more than 15% from each other on any day.

