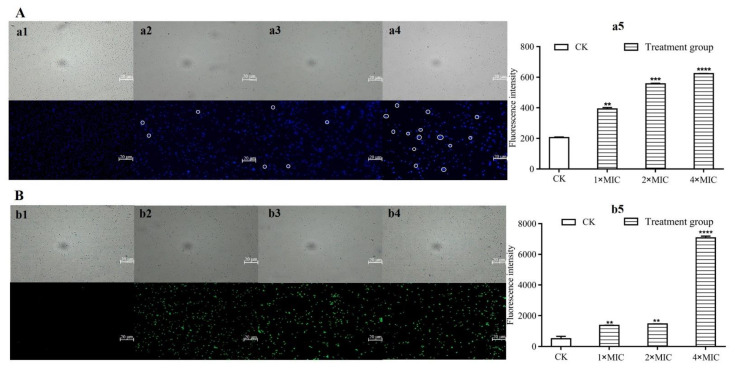
Figure 6.
Effects of L-36 CFCS on subcellular structure of S. aureus. (A) DAPI uptake of S. aureus observed under fluorescence microscopy and fluorescence intensity were determined by automatic microplate reader. (a1) Control, (a2) L-36 CFCS at 1 × MIC, (a3) L-36 CFCS at 2 × MIC, (a4) L-36 CFCS at 4 × MIC, (a5) is the measurement result of fluorescence intensity corresponding to the experiment, and CK is untreated L-36 CFCS. (B) DCFH-DA uptake of S. aureus observed under fluorescence microscopy and fluorescence intensity were determined by automatic microplate reader. (b1) Control, (b2) L-36 CFCS at 1 × MIC, (b3) L-36 CFCS at 2 × MIC, (b4) L-36 CFCS at 4 × MIC, (b5) is the measurement result of fluorescence intensity corresponding to the experiment, and CK is untreated L-36 CFCS. Statistically significant differences (determined by Student’s t test) are indicated as **** p < 0.00001, *** p < 0.001, and ** p < 0.01 vs. the control.

