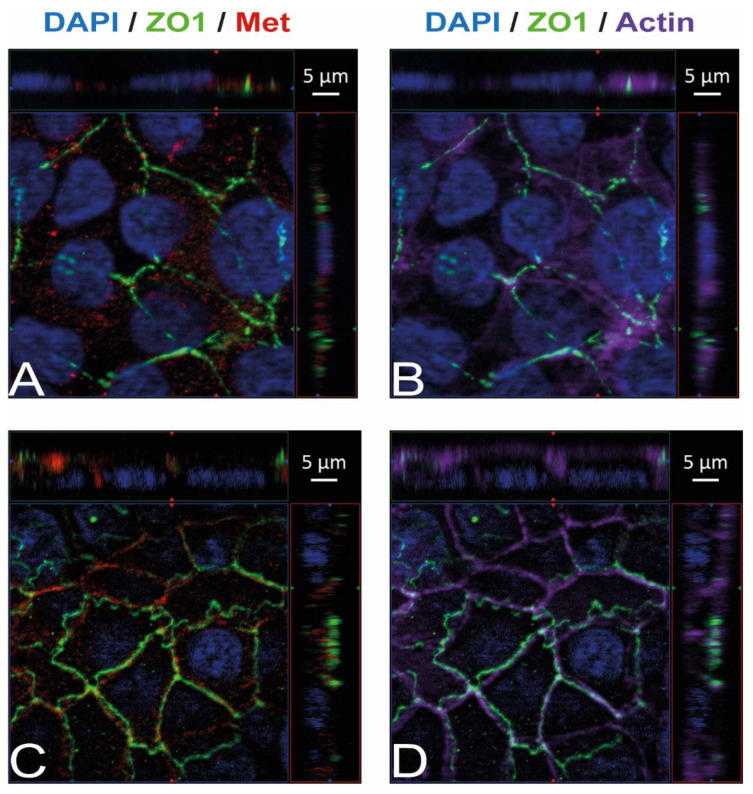
Figure 3.
Met is present in HBMEC and HIBCPP cells. Immunofluorescence staining was performed with HBMEC (A,B) and HIBCPP cells (C,D). Met staining (A,C) is shown in red; the phalloidin-stained actin cytoskeleton (B,D) is shown in purple. Tight junctions are visualized via the staining of ZO1 (green); nuclei are stained with DAPI (blue). All panels represent Apotome images. The center part of each image displays an xy enface view presented as a maximum intensity through the z-axis of selected slices. The top and right-side parts of each panel are cross sections through the z-plane of multiple optical slices. The apical sides of HBMEC and HIBCPP cells are oriented toward the top of the top part and towards the right of the right part of each panel, respectively.

