Figure 3.
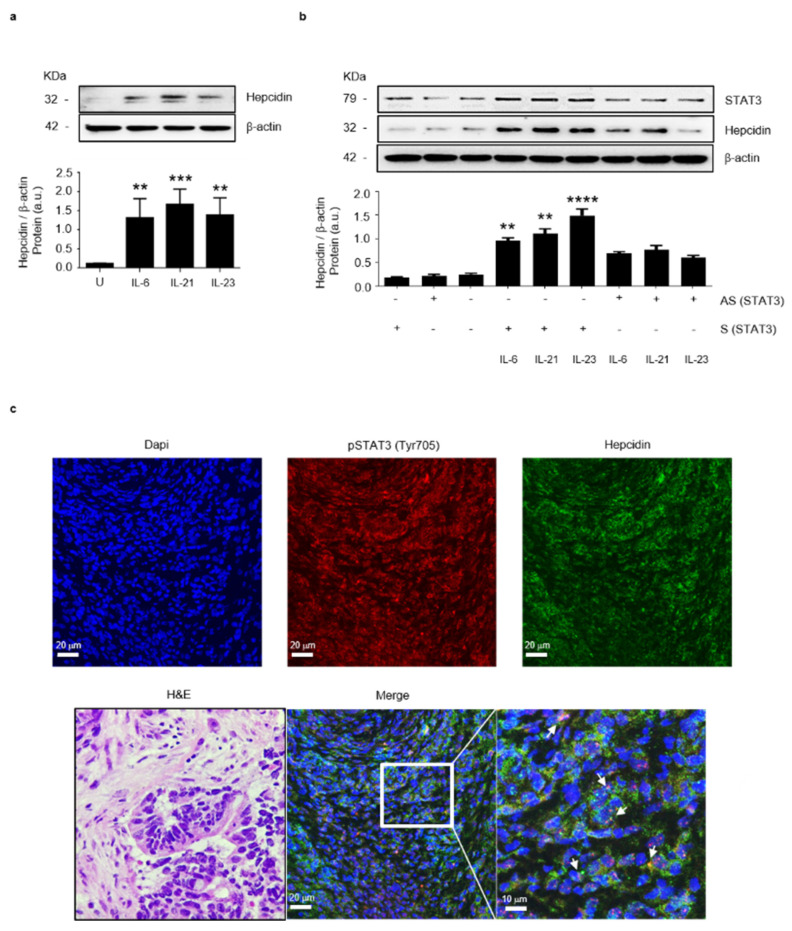
Stat3 regulates positively hepcidin expression in colon epithelial cells. (a) Representative Western blots showing hepcidin and β-actin in HCEC-1ct cells stimulated with IL-6, IL-21 and IL-23. Lower panel shows the quantitative analysis of hepcidin/β-actin protein ratio, as measured by densitometry scanning of Western blots of 3 different experiments. Values are expressed in arbitrary units (a.u.) and indicate mean ± SD of all experiments; [Unstimulated (U) versus IL-6, ** p< 0.01; U versus IL-21, *** p < 0.001; U versus IL-23, ** p < 0.01]. (b) Representative Western blots showing p-Stat3, hepcidin and β-actin in HCEC-1ct cells transfected with sense (S) or Stat3 antisense (AS) oligonucleotide and then stimulated with IL-6, IL-21 and IL-23, as indicated in materials and methods. Lower panel shows the quantitative analysis of hepcidin/β-actin protein ratio as measured by densitometry scanning of Western blots of 3 different experiments. Values are expressed in arbitrary units (a.u.) and indicate mean ± SD of all experiments; (S/IL-6 versus AS/IL-6, ** p< 0.01; S/IL-21 versus AS/IL-21, ** p < 0.01; S/IL-23A versus AS/IL-23A, **** p < 0.0001; n = 3). (c) Representative confocal laser scanning microscopy images showing p-Stat3 (Tyr 705) (red) and hepcidin (green) in CRC sections; nuclei are stained with 4′,6-diamidino-2- phenylindole (DAPI) (blue). White arrows indicate cells co-expressing both p-Stat3 and hepcidin. The left image shows the hematoxylin/eosin (H&E) staining of a serial section taken from the same CRC tissue assessed by confocal microscopy.

