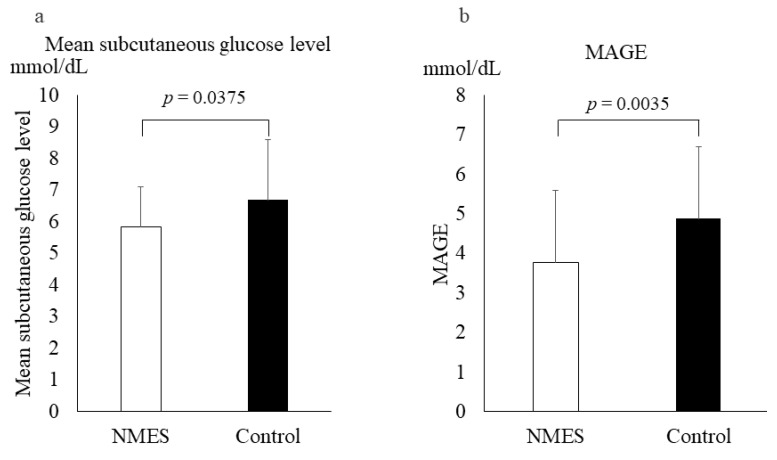
Figure 2.
(a) Mean subcutaneous glucose level and (b) mean amplitude of glycemic excursion (MAGE) for 24 h after completion of hemodialysis with a single bout neuromuscular electrical stimulation (NMES) session after supplementary nutritional food intake in stage 1; NMES: white bars, control: black bars. Values represent the mean ± standard deviation of the 11 participants. Mean blood glucose level after hemodialysis for >24 h. Paired t-test of Δvalues when comparing differences between periods. Effect of the 12 week NMES on Glycemic Control.

