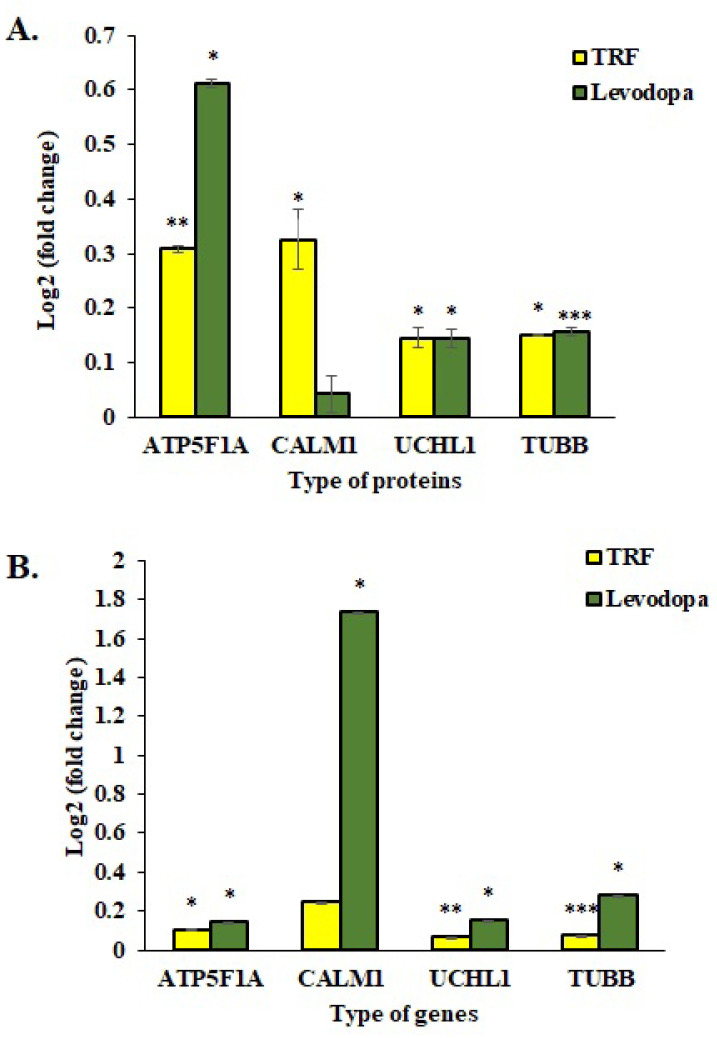
Figure 6.
Validation study of mRNA expressions of four selected genes, ATP5F1A, CALM1, UCHL1 and TUBB. (A) The log2 fold change protein expression following TRF and levodopa treatment on diff-neural cells. (B) The log2 fold change values of selected mRNA expression following TRF and levodopa treatment on diff-neural cells. For calculation of p value, the normalized data set from TRF and levodopa treated group were compared against normalized data obtained from untreated control group. The values are expressed as mean ± SEM (n = 3), Significant difference * p < 0.05, ** p < 0.01, *** p < 0.001 compared to untreated control group.

