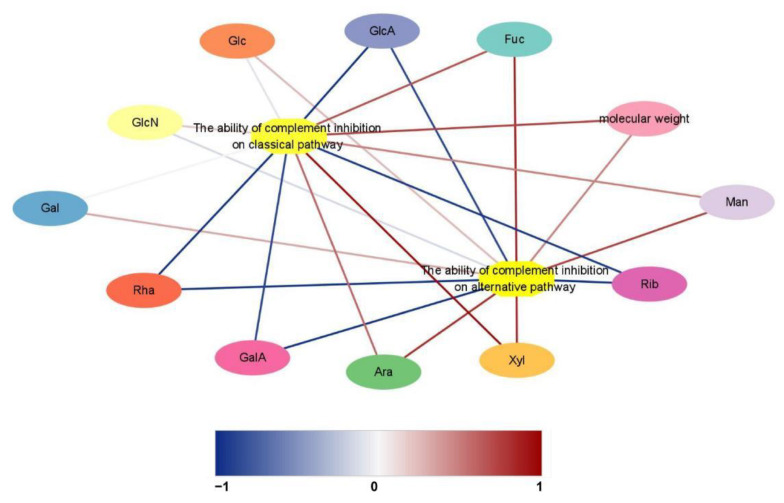
Figure 10.
Network analysis of monosaccharide composition and molecular weight associated with the anti-complementary activity of CMPs. Red lines represent the positive correlation between structure and activity (r > 0.99). Blue lines represent the negative correlation between structure and activity (r > 0.99). The darker the line color, the higher is the significance of the correlation between structure and bioactivity.

