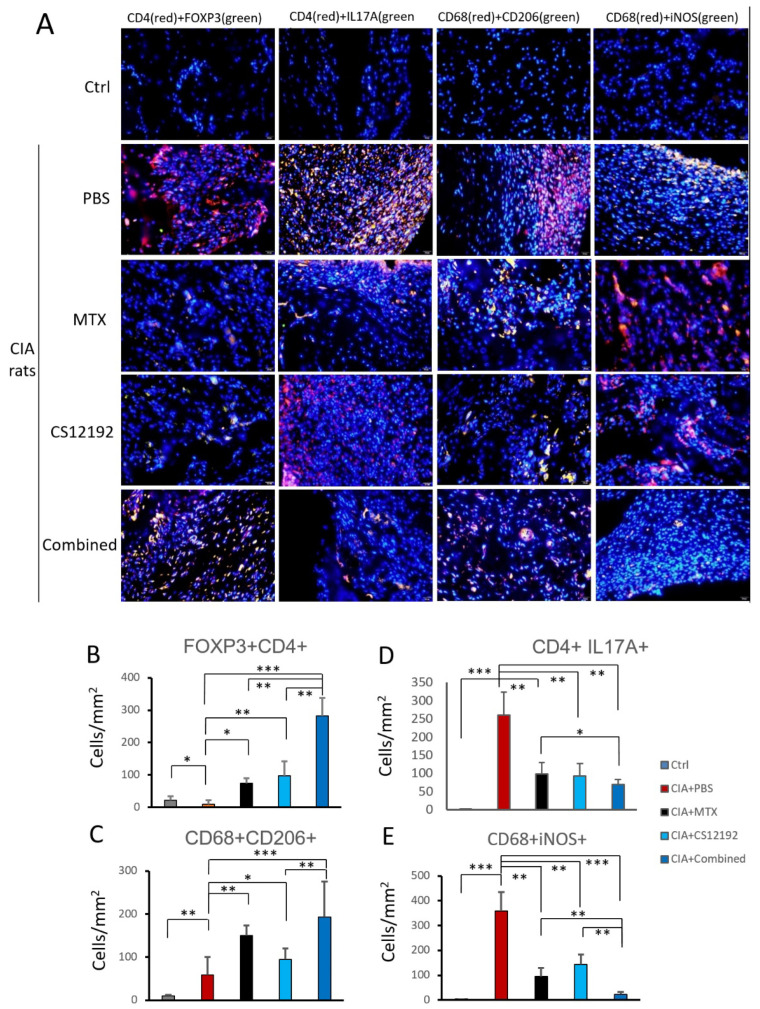
Figure 4.
Effects of MTX, CS12192, or the combination of CS12192 and MTX treatments on T cell and macrophage infiltration and activation in CIA rats on day 28 by two-color immunofluorescence, (A) Representative two-color immunofluorescence for Treg cells (CD4+ FOXP3+), Th17 cells (CD4+ IL-17A+), M2 macrophages (CD68+ CD206+), and M1 macrophages (CD68+ iNOS+) infiltrating joint tissues on day 28 after the first immunization of CIA rats receiving different treatments. Nuclei were stained with DAPI (blue); (B–E) Quantitative analysis of T cell and macrophage subsets infiltrating the joint tissues. Each bar represents the mean ± SEM for 10 CIA rats in different groups. Scale bar = 50 μm. * p < 0.05; ** p < 0.01; and *** p < 0.001 vs. CIA group.

