Figure 2.
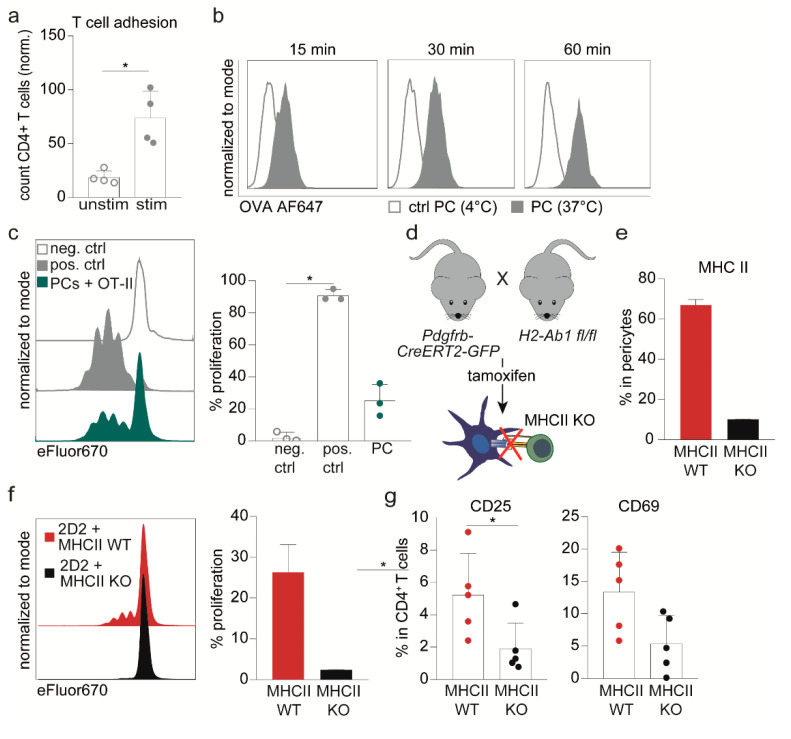
Pericytes activate T cells in an antigen-specific manner. (a) Bar graph depicts the quantification of the adhesion of stimulated or unstimulated CD4+ T cells to pericytes evaluated via immunofluorescence. (b) Histograms show the uptake of Alexa Fluor 647-labeled OVA protein at 37 °C and at 4 °C (as control) by pericytes at indicated time points. (c) Proliferation assessed by flow cytometric analysis of antigen-specific activated OT-II CD4+ T cells after 72 h co-cultivation with pericytes (PCs) loaded with specific OVA peptide (OVA323–339). As positive control (pos. ctrl) DC loaded with specific OVA peptide were used while unstimulated cells were used as negative control (neg. ctrl.). Depicted are representative proliferation profiles (left) and percentages of proliferated T cells (right, n = 3). (d) Scheme of the Pdgfrb-CreERT2-MHCII mouse model. Tamoxifen administration leads to depletion of MHC II on pericytes in Cre+ littermates, whereas pericytes in Cre− littermates remain unaffected. (e) Bar graph depicts representative frequencies of MHC II-expressing pericytes after 72 h TCS stimulation of in vitro Cre-recombined (MHC II KO) or untreated (MHC II WT) cortical pericytes of Pdgfrb-CreERT2-MHCII mice (n = 2). (f) Proliferation of 2D2 CD4+ T cells is shown after co-cultivated for 72 h with either MHC II WT or MHC II KO pericytes loaded a particular neurofilament (NFM15–35) peptide. Depicted are representative proliferation profiles (left) and percentages of proliferated T cells (right, n = 2). (g) Dot plots depict the frequencies of 2D2 CD4+ T cells expressing early activation marker CD25 and CD69 when co-cultivated with NFM15–35-loaded MHC II KO pericytes compared to WT pericytes after 48 h. Data from (a,c,g) depict mean ± SD of at least three independent experiments. Single dots represent values of one individual experiment. (b,e,f) represent on exemplary experiment out of four different experiments. Statistical analysis was performed using Kruskal–Wallis Test for three groups (c; one-way ANOVA) and Mann–Whitney U-test for two groups (g). * p ≤ 0.05.

