Figure 3.
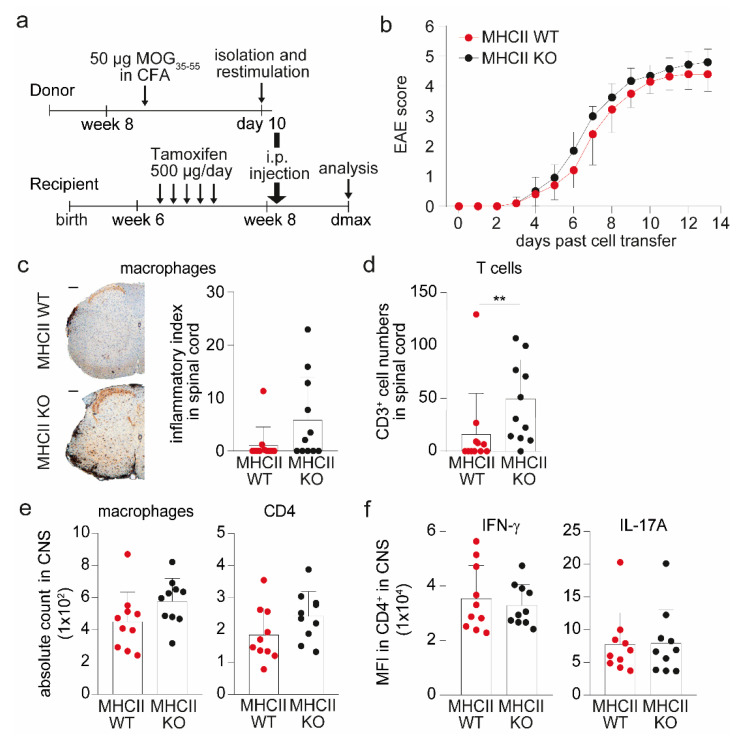
Pericytes control local T cell infiltration in an MHC II-dependent manner during AT-EAE. (a) Schematic overview of AT-EAE experiments in Pdgfrb-CreERT2-MHCII animals is shown. (b) Disease course of one AT-EAE experiment is illustrated as a clinical score of MHC II WT (n = 10) compared to MHC II KO mice (n = 10). (c) Histological analysis was performed with regard to cell infiltration into the spinal cords. Depicted are representative images of histological sections stained with MAC3+ to evaluate macrophage infiltration into the spinal cord of MHC II WT mice and MHC II KO animals (left, scale bar = 200 µm). Quantification of the staining is illustrated as inflammatory index, which is calculated as the ratio between the area of infiltrated macrophages and the area of white matter (right, n = 11 mice/group). (d) Bar graph depicts the mean count of CD3+ T cells in the spinal cords of MHC II KO (n = 11) mice compared to MHC II WT (n = 11) mice by histological analysis. (e) Absolute cell counts of infiltrated macrophages and CD4+ T cells in the CNS of Pdgfrb-CreERT2-MHCII animals evaluated via flow cytometry are shown. (f) Bar graphs depict the mean fluorescence intensities (MFI) of pro-inflammatory cytokines IFN-γ and IL-17A in CD4+ T cells isolated from the CNS of MHC II KO or MHC II WT animals. All data are shown as mean ± SD. Single dots represents individual values of single mice. Statistical analysis was performed using Mann–Whitney U-test. ** p ≤ 0.01.

