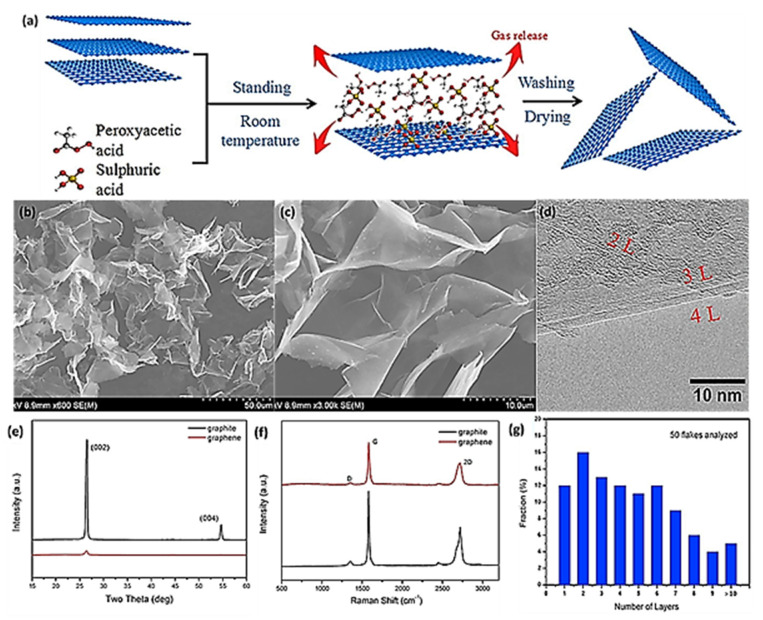
Figure 5.
(a) Graphical representation of graphene production via chemical exfoliation; (b,c) SEM micrographs of as-obtained graphene; (d) HR-TEM image; (e) XRD spectra of graphite and pristine graphene; (f) Raman spectra of graphite and pristine graphene; and (g) thickness of graphene with diverse number of layers represented statistically. Adopted with permission from [65].

