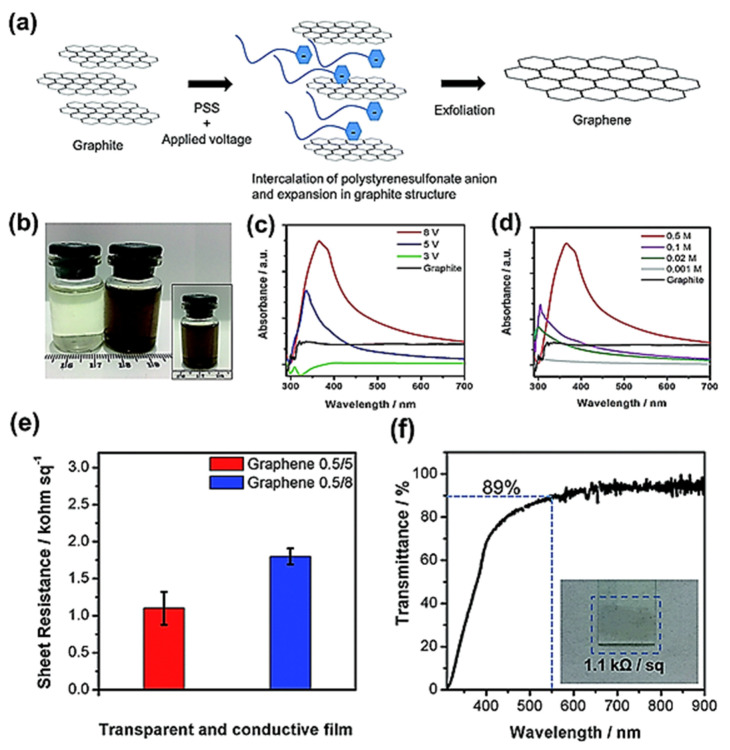
Figure 10.
(a) Schematic of graphene production process, (b) 0.5 M PSS solution graphene-PSS dispersion acquired under 8V DC. (c,d) The UV-vis profile at varying and 8V DC voltage, respectively. (e,f) Transmittance and sheet resistance-produced samples. Reproduced with permission from [81].

