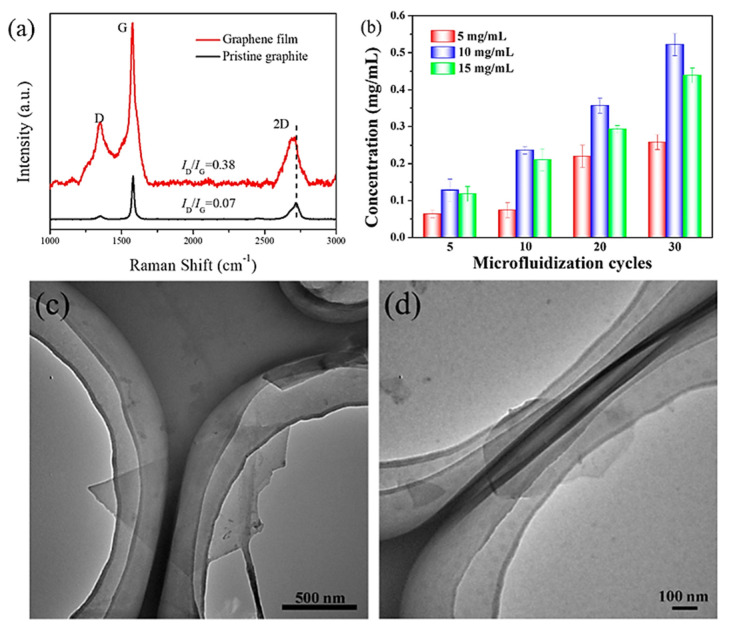
Figure 12.
(a) Raman spectra of as-prepared graphene and pristine graphite; (b) concentration of graphene with the number of microfluidization cycles; and (c,d) TEM micrographs after 20 and 30 microfluidization cycles, respectively. Adopted with permission from [88].

