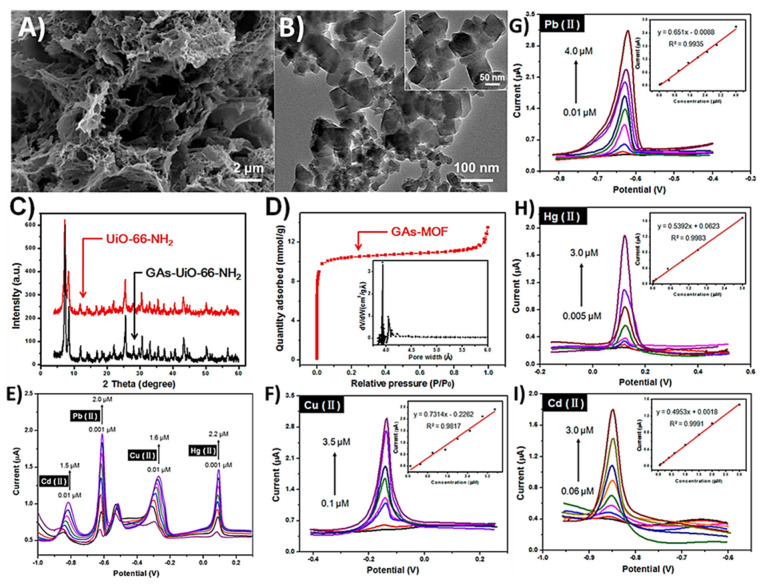
Figure 22.
SEM image of (A) GAs, TEM image of (B) UiO-66-NH2, (C) XRD spectra, (D) N2 adsorption-desorption isotherm of the GAs-UiO-66-NH2, (E) DPSV response of the GAs-UiO-66-NH2 altered GCE after adding diverse concentrations of Cd2+, Pb2+, Cu2+, and Hg2+ in acetate buffer solution (0.2 M, pH 5.0, DPSV response of the GA-UiO-66-NH2 altered GCE for specific analysis of (I) Cd2+, (F) Cu2+, (G) Pb2+, and (H) Hg2+ over a concentration range of 0.06−3.0 μM, 0.01−4.0 μM, 0.1−3.5 μM, and 0.005−3.0 μM, respectively. Reproduced with the permission from [198].

