Figure 1.
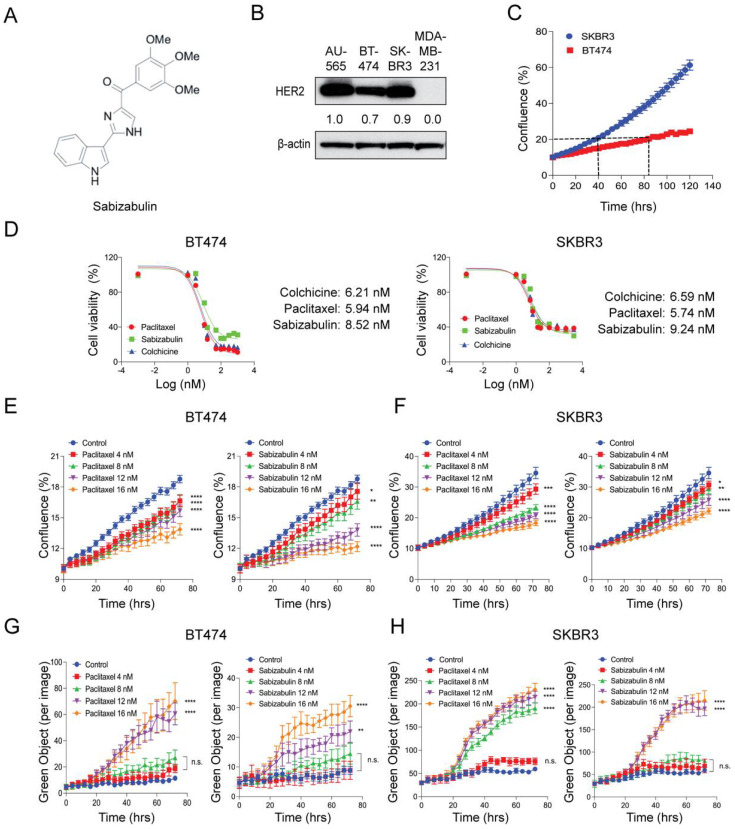
Effect of sabizabulin, colchicine, or paclitaxel in BT474 and SKBR3 HER2+ cell lines. (A) Chemical structure of sabizabulin. (B) Levels of HER2 in breast cancer cell lines were determined by western blotting; β-actin serves as a loading control. Signal intensity was evaluated by ImageJ densitometry with the AU565 sample set to 1.0. (C) Proliferation assay over time (120 h) using BT474 and SKBR3 cells to determine doubling times by confluence (%) using the IncuCyte S3 instrument (5000 cells/96-well; n = 4 wells/cell line). (D) The growth inhibition effect of sabizabulin relative to colchicine or paclitaxel was determined by MTS assay after 72 h or 96 h (SKBR3 or BT474, respectively) over a range of concentrations (0.3 nM to 3.0 µM, on a log (nM) scale) and expressed as cell viability (%)representative response curves of three independent biological replicates are shown. (E,F) Growth inhibition assays for BT474 cells (E) or SKBR3 cells (F) treated with paclitaxel or sabizabulin at increasing concentrations as measured by confluence (%) over time (hrs). (G,H) Evaluation of time- and concentration-dependent cytotoxicity for BT474 (G) and SKBR3 (H) cells as enumerated by Cytotox Green reagent counts (Green Object per image) over time (hrs).All p-values are shown as pairwise comparisons to the vehicle (control) group; * p < 0.05; ** p < 0.01, *** p < 0.001, **** p < 0.0001; n.s., not significant.

