Figure 2.
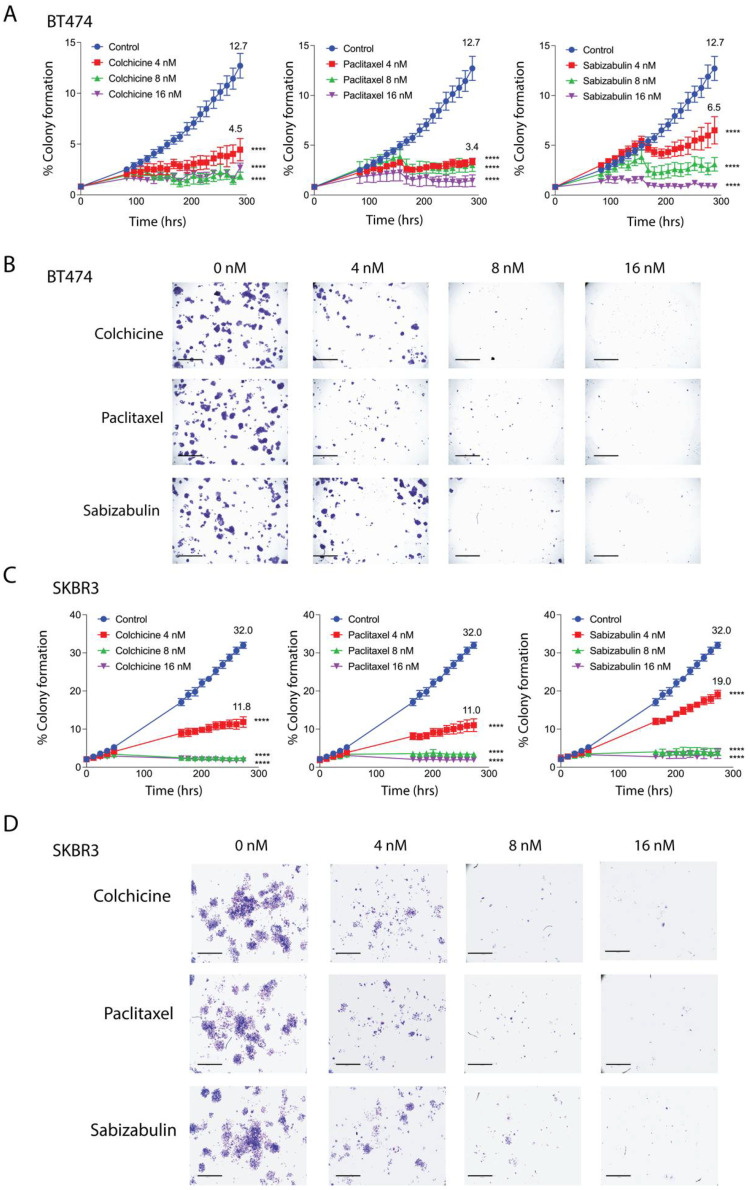
Effect of colchicine, paclitaxel and sabizabulin on colony formation in HER2+ breast cancer cell lines. The growth of colonies was measured for 12 days (288 hrs) in the presence of colchicine, paclitaxel or (4, 8, or 16 nM). (A,B) The area occupied by colonies over time was converted to a percentage (%) to enumerate colony formation. The mean percent colony formation is indicated at the study endpoint for control and 4 nM treated cells (A,C). All data represent the grand mean of two independent biological experiments, each assay was performed with n = 8 technical replicates/time point/cell line. Two-way ANOVA was performed followed by Dunnett’s multiple comparisons testing. All p-values are shown compared to the vehicle control group at the experimental endpoint; **** p < 0.0001. Representative pictures of stained colonies for BT474 (C) and SKBR3 (D) cells at assay endpoint are shown; scale bars, 50 μM.

