Figure 5.
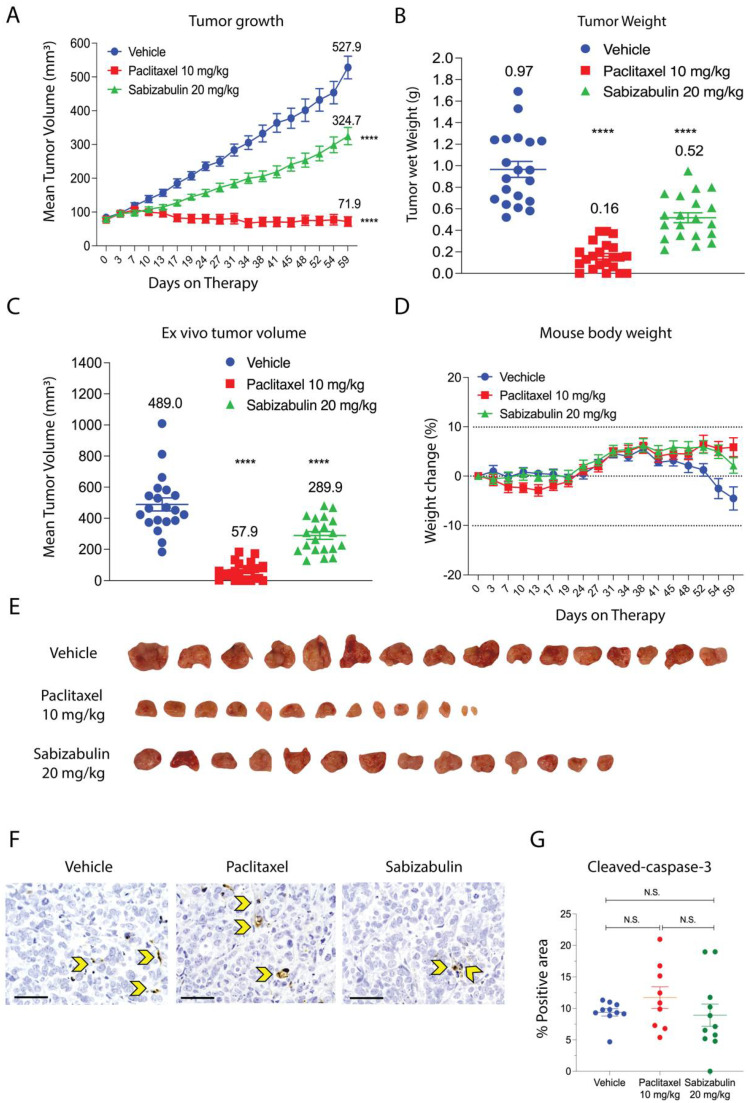
Sabizabulin inhibits primary tumor growth in the HCI-12 PDX model. (A) The mean increase in tumor volume (mm3) over time on treatment (days on therapy, A) and tumor wet weight (grams, g) (B) at the study endpoint of59 days after treatment with vehicle (3×/week, IP, n = 21 total tumors), paclitaxel (10 mg/kg; 3×/week, IP, n = 22 total tumors), or sabizabulin (20 mg/kg, 3×/week, PO, n = 18 total tumors). (C) The mean ex vivo tumor volume and the percentage increase in body weight for vehicle (n = 11 mice), paclitaxel (n = 11 mice), or sabizabulin (n = 12 mice) relative to body weight at the start of therapy (D); the dashed lines indicate initial body weight (y = 0) with a −10% to +10 % variance over time (days on therapy)(A–C) All pairwise comparisons were made to the vehicle control; **** p < 0.001. (E) Representative images of resected tumors. (F) Representative images of IHC slides stained with cleaved caspase-3 (600× magnification; scale bar 50 μM); yellow arrowheads indicate example apoptotic cells. (G) Scatter plot of % positive area for cleaved-caspase-3. N.S. = not significant.

