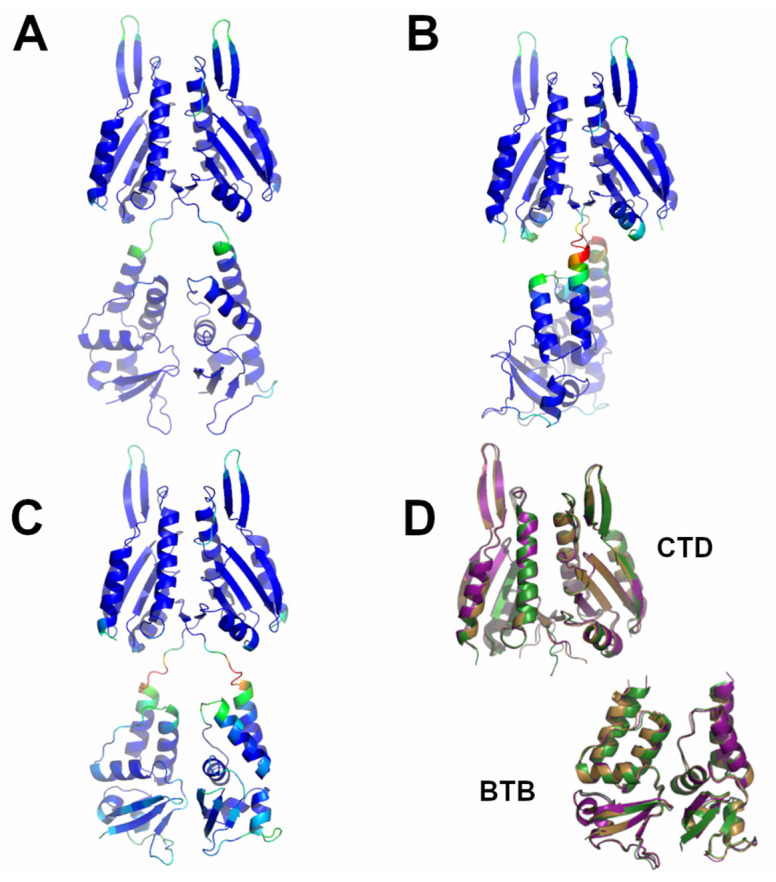
Figure 8.
Schematic representation of AF full-length structures of members of Cluster 6. (A) KCTD10; (B) KCTD13; (C) TNFAIP1; (D) superimposed CTD and BTB domains (KCTD10 in purple; KCTD13 in dark green; TNFAIP1 in sand). Structural models in panels A-C are colored following AF per-residue confidence metric (pLDDT).

