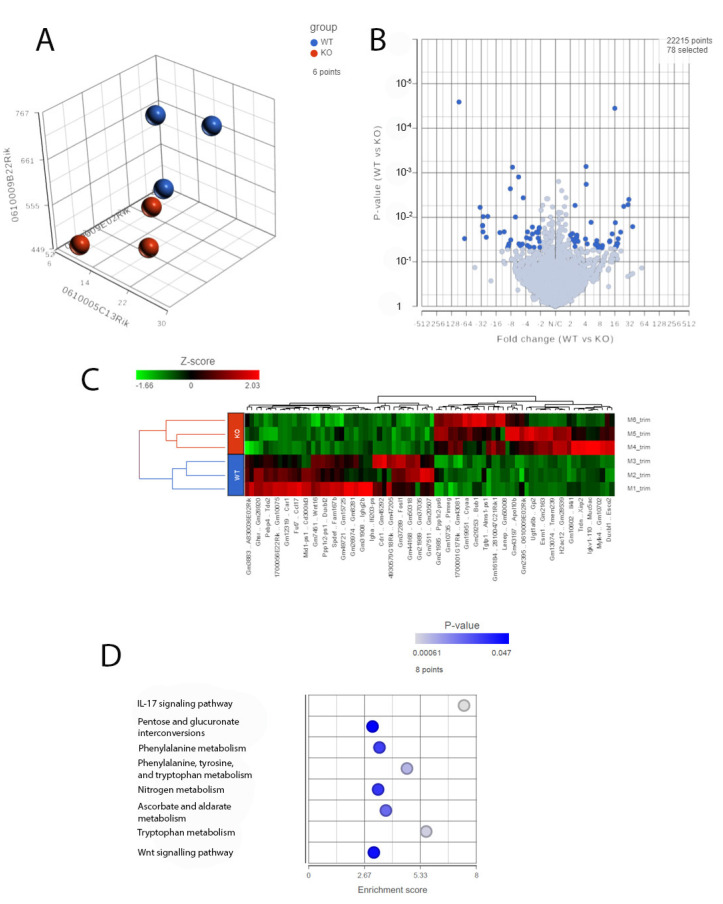
Figure 7.
RNA-Seq analysis of 1-year-old wild-type and KO mice. (A). PCA plots of RNA-Seq data showing the characteristics of the overall gene expression of each sample. (B). Volcano plot showing expression changes between the wild-type and KO mice. (C). Heat map displaying the expression profile of the top differentially expressed genes. (D). GO pathway enrichment in the KO mice compared with the wild-type mice (adjusted p < 0.05).

