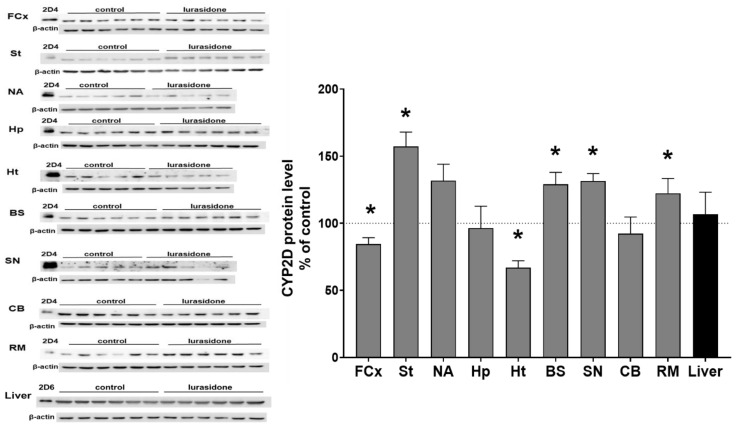
Figure 2.
The effect of two-week treatment with lurasidone on the CYP2D protein levels measured in microsomes derived from the selected brain structures or liver. The presented values are the means ± S.E.M. of 15 samples (from 15 animals) for the cerebellum, remainder of brain, and the liver; of 7 samples (each sample contained 2 pooled brain structures from 2 animals) for the frontal cortex, brain stem, striatum, and hippocampus; or of 5 samples (each sample contained 3 pooled brain structured from 3 animals) for the hypothalamus, nucleus accumbens, and substantia nigra. The representative CYP2D protein bands of the Western blot analysis are shown. Brain or liver microsomal protein (10 µg) was subjected to Western blot analysis. cDNA-expressed CYP2D4 protein (Bactosomes) and cDNA-expressed CYP2D6 protein (Supersomes) was used as a positive control. Student’s t-test: * p < 0.05 vs. control group. FCx—the frontal cortex, St—the striatum, NA—the nucleus accumbens, Hp—the hippocampus, Ht—the hypothalamus, BS—the brain stem, SN—the substantia nigra, CB—the cerebellum, and RM—the remainder.

