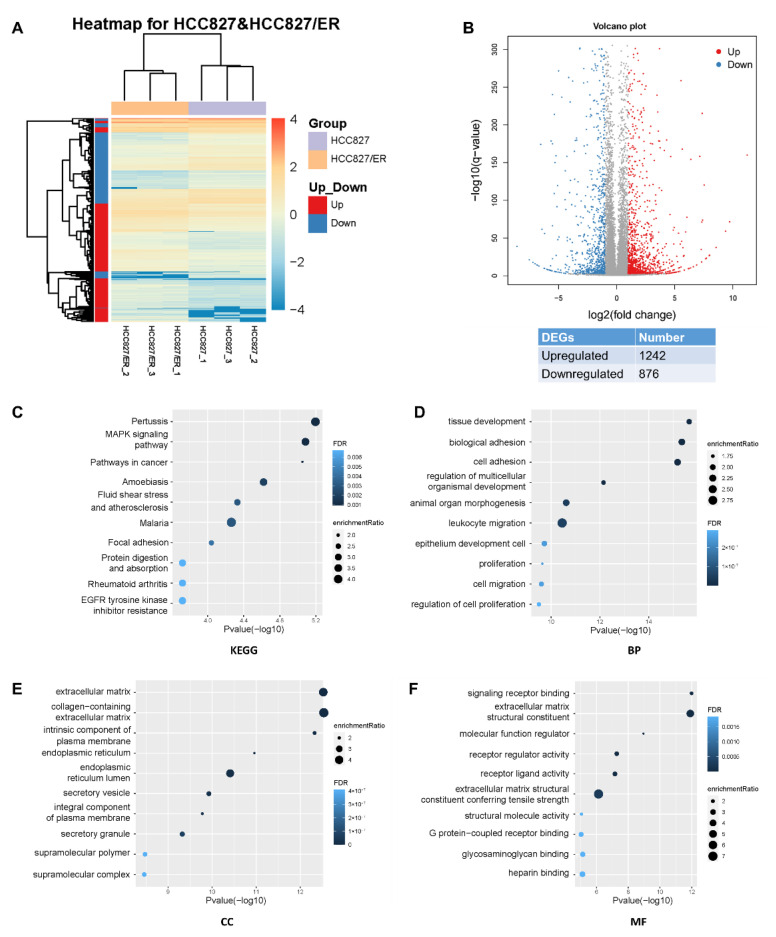
Figure 1.
Profound changes in the global transcriptional landscape between parental and erlotinib-resistant cells. (A) Heatmap of genes that were differentially expressed (DEGs) between HCC827 and HCC827/ER cells. The color represents the level of transformed gene expression of log10. (B) Volcano plot displaying genes detected by RNA-Seq. Red points represent up-regulated DEGs (FoldChange ≥ 2, q value ≤ 0.001). Blue points represent down-regulated DEGs (FoldChange ≤ −2, q value ≤ 0.001). Gray points represent non-DEGs. (C) KEGG pathway enrichment analysis of genes up-regulated or down-regulated in pairwise comparison of HCC827 and HCC827/ER cells. FDR ˂ 0.05 signified statistical significance. (D) Biological process, (E) cellular components, and (F) molecular function annotations of gene ontology were significantly enriched in genes that were differentially expressed between HCC827 and HCC827/ER cells. Top 10 terms of each class were performed. FDR ˂ 0.05 signified statistical significance.

